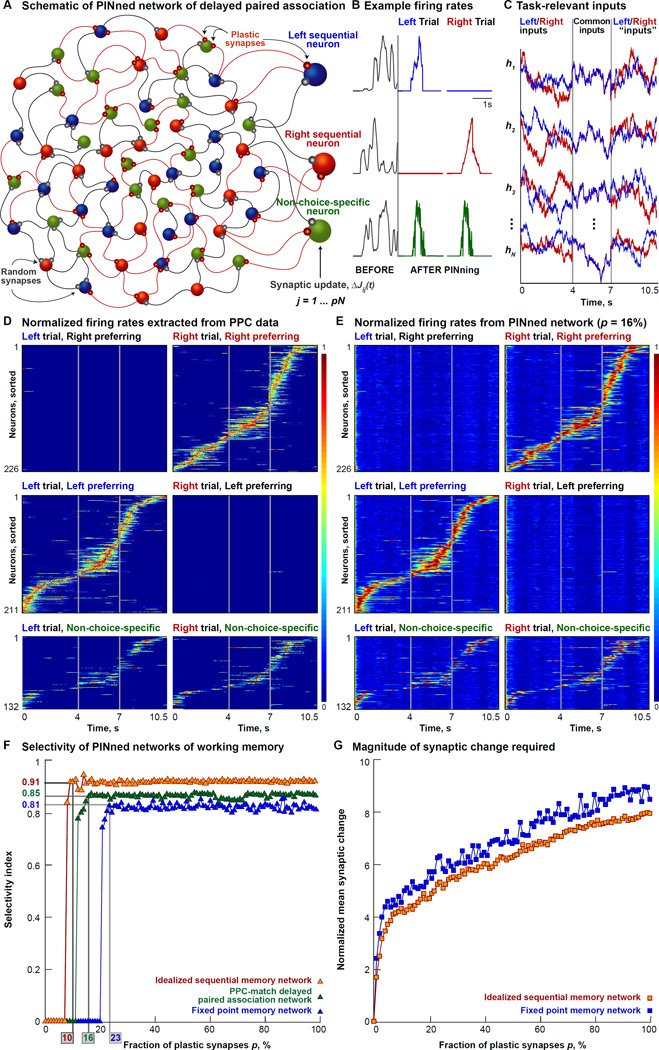
Figure 5. Delayed Paired Association In PINned Networks Of Working Memory.
A. Schematic of a sparsely PINned network implementing delayed paired association through a 2AFC task [Harvey, Coen and Tank, 2012]. The targets for PINning are firing rates extracted from Ca2+ imaging data from left preferring PPC cells (schematized in blue), right preferring cells (schematized in red) and cells with no choice preference (in green, called non-choice-specific neurons). As in Figure 2B, the learning rule is applied only to p% of the synapses.
B. Example single neuron firing rates, normalized to the maximum, before (gray) and after PINning (blue trace for left preferring, red trace for right preferring and green trace for non-choice-specific neurons) are shown here.
C. A few example task-specific inputs (hi for i = 1, 2, 3, …, N) are shown here. Each neuron gets a different irregular, spatially delocalized, filtered white-noise input, but receives the same one on every trial. Left trial inputs are in blue and the right trial ones, in red.
D. Normalized firing rates extracted from trial-averaged Ca2+ imaging data collected in the PPC during a 2AFC task are shown here. Spike trains are extracted by deconvolution from mean calcium fluorescence traces for the 437 choice-specific and 132 non-choice-specific, task-modulated cells (one cell per row) imaged on preferred and opposite trials [Harvey, Coen and Tank, 2012]. These firing rates are used to extract the target functions for PINning (schematized in (A)). Traces are normalized to the peak of the mean firing rate of each neuron on preferred trials and sorted by the time of center-of-mass (tCOM). Vertical gray lines indicate the time points corresponding to the different epochs of the task – the cue period ending at 4s, the delay period ending at 7s, and the turn period concluding at the end of the trial, at 10.5s.
E. The outputs of the 569-neuron network with p = 16% plastic synapses, sorted by tCOM and normalized by the peak of the output of each neuron, showing a match with the data (D). For this network, pVar = 85%.
F. Selectivity index, shown here, is computed as the ratio of the difference and the sum of the mean activities of preferred neurons at the 10s time-point during preferred trials and the mean activities of preferred neurons during opposite trials. Task performance of 3 different PINned networks of working memory as a function of the fraction of plastic synapses, p – an idealized sequential memory model (orange triangles, N = 500), a model that exhibits PPC-like dynamics (green triangles, N = 569, using rates from (D)) and a fixed point memory network (blue triangles, N = 500) – are shown here. The network that exhibits long-duration population dynamics and memory activity through idealized sequences (orange triangles) has selectivity = 0.91, when p = 10% of its synapses are plastic; the PPC-like network needs p = 16% plastic synapses for selectivity = 0.85, and the fixed point network needs p = 23% of its synapses to be plastic for selectivity = 0.81.
G. Magnitude of synaptic change (computed as for Figure 2E) for the 3 networks shown in (F) here. The idealized sequential (orange squares) and the fixed point memory network (blue squares) require comparable amounts of mean synaptic change to execute the DPA task, growing from ~3 to ~9 for p = 10–100%. Across the matrix, the total amount of synaptic change is smaller, even though individual synapses change more in the sparsely PINned case. PPC-like memory network omitted here for clarity.

