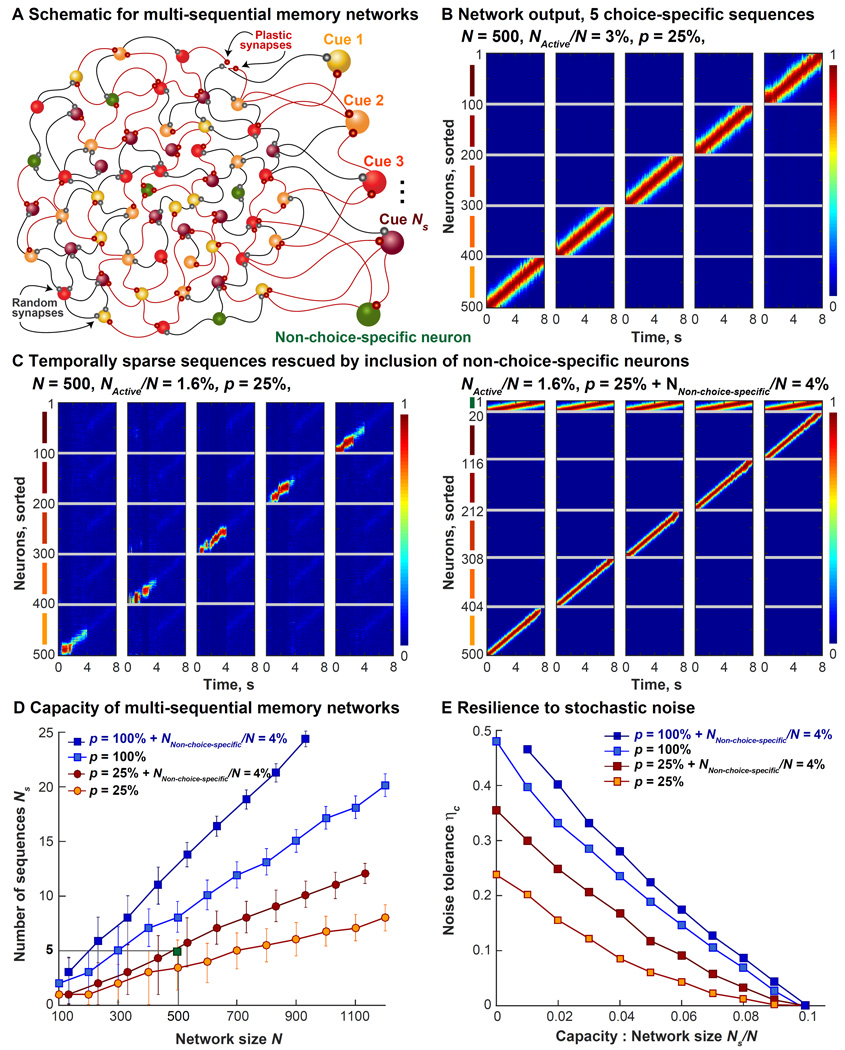
Figure 6. Capacity of Multi-Sequential Memory Networks.
A. Schematic of a multi-sequential memory network (N = 500) is shown here. N/Ns neurons are assigned to each sequence that we want the network to simultaneously produce. Here, Ns is the capacity. Only p% of the synapses are plastic. The target functions are identical to Figure S2A, however, their widths, denoted by NActive/N, varies as a task parameter controlling how many network neurons are active at any instant.
B. The normalized firing rates of the 500-neuron network with p = 25% and NActive/N = 3% are shown here. The memory task (the cue periods and the delay periods only) is correctly executed through 5 choice-specific sequences; during the delay period (4–8s), neurons fire in a sequence only on trials of the same type as their cue preference.
C. Left panel shows the same network as (B) failing to perform the task correctly when the widths of the targets was halved (NActive/N = 1.6%), sparsifying the sequences in time. Memory of the cue identity is not maintained during the delay period. Right panel shows the result of including a small number of non-choice-specific neurons (NNon-choice-specific/N = 4%) that fire in the same order in trials of all 5 types. Including non-choice-specific neurons restores the memory of cue identity during the delay period, without increasing p.
D. Capacity of multi-sequential memory networks, Ns, as a function of network size, N, for different values of p is shown here. Mean values are indicated by orange circles for p = 25% PINned networks, red circles for p = 25% + NNon-choice-specific/N = 4%, light blue squares for p = 100% and dark blue squares for p = 100% + NNon-choice-specific/N = 4% neurons. PINned networks containing additional non-choice-specific neurons have temporally sparse target functions with NActive/N = 1.6%, the rest have NActive/N = 3%. Error bars are calculated over 5 different random instantiations each and decrease under the following conditions: as network size is increased, as fraction of plastic synapses p is increased, and moderately with the inclusion of non-choice-specific neurons. The green square highlights the 500-neuron network whose normalized outputs are plotted in (B).
E. Resilience of different multi-sequential networks is computed as the critical amount of stochastic noise (denoted here by ηc) tolerated before the memory task fails, is shown here. Tolerance, plotted here as a function of the ratio of multi-sequential capacity and network size, Ns/N, decreases as p is lowered and as capacity increases, although it falls slower with the inclusion of non-choice-specific neurons. Only mean values shown here for clarity.

