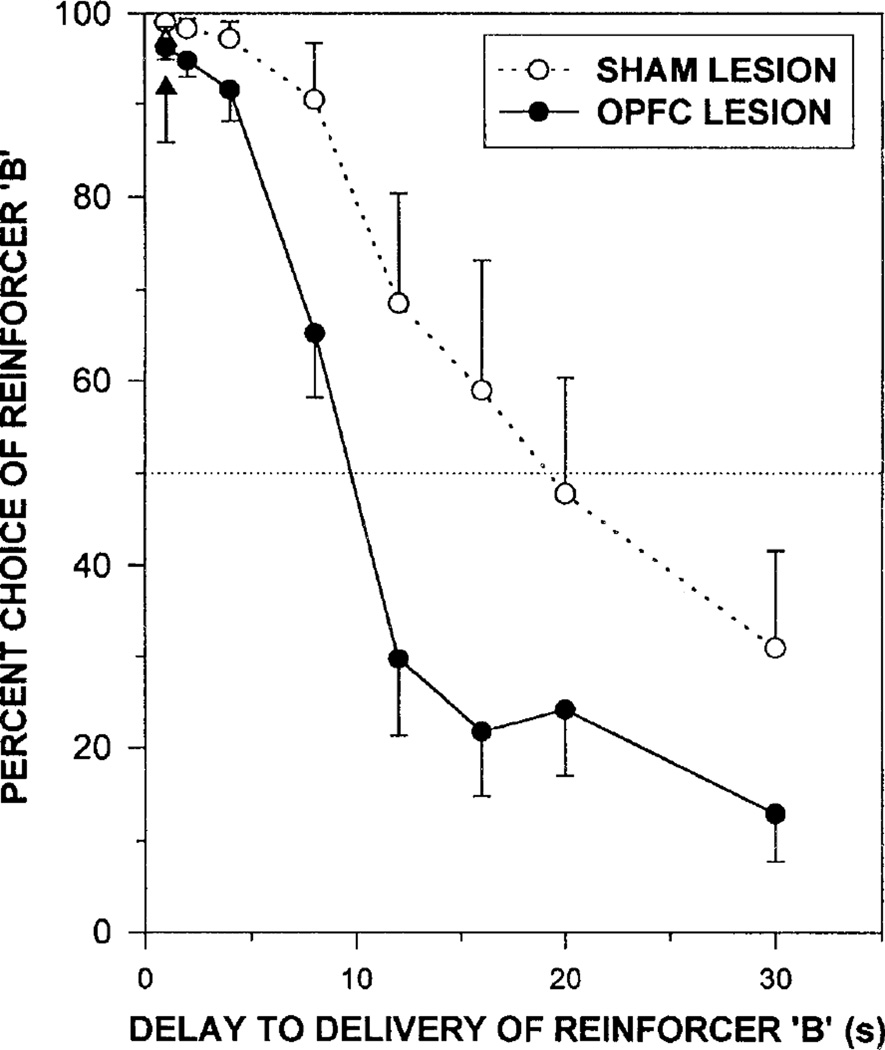
Figure 5.
Mean percentage choice of the larger reinforcer as a function of the delay to the reinforcer. Filled circles represent choice by rats after orbital prefrontal cortex (OPFC) lesion, and open circles represent choice by the sham lesion control rats. (Error bars show one standard error of the mean.) The dotted horizontal line represents the indifference point, at which the smaller, sooner and the larger, later reinforcers each are chosen 50% of the time. Figure is adapted from “Effects of lesions of the orbitofrontal cortex on sensitivity to delayed and probabilistic reinforcement” by S. Mobini, S. Body, M.-Y. Ho, C. Bradshaw, E Szabadi, J. Deakin, and I Anderson, 2002, Psychopharmacology, 160, p. 292. Copyright 2002 by Springer.

