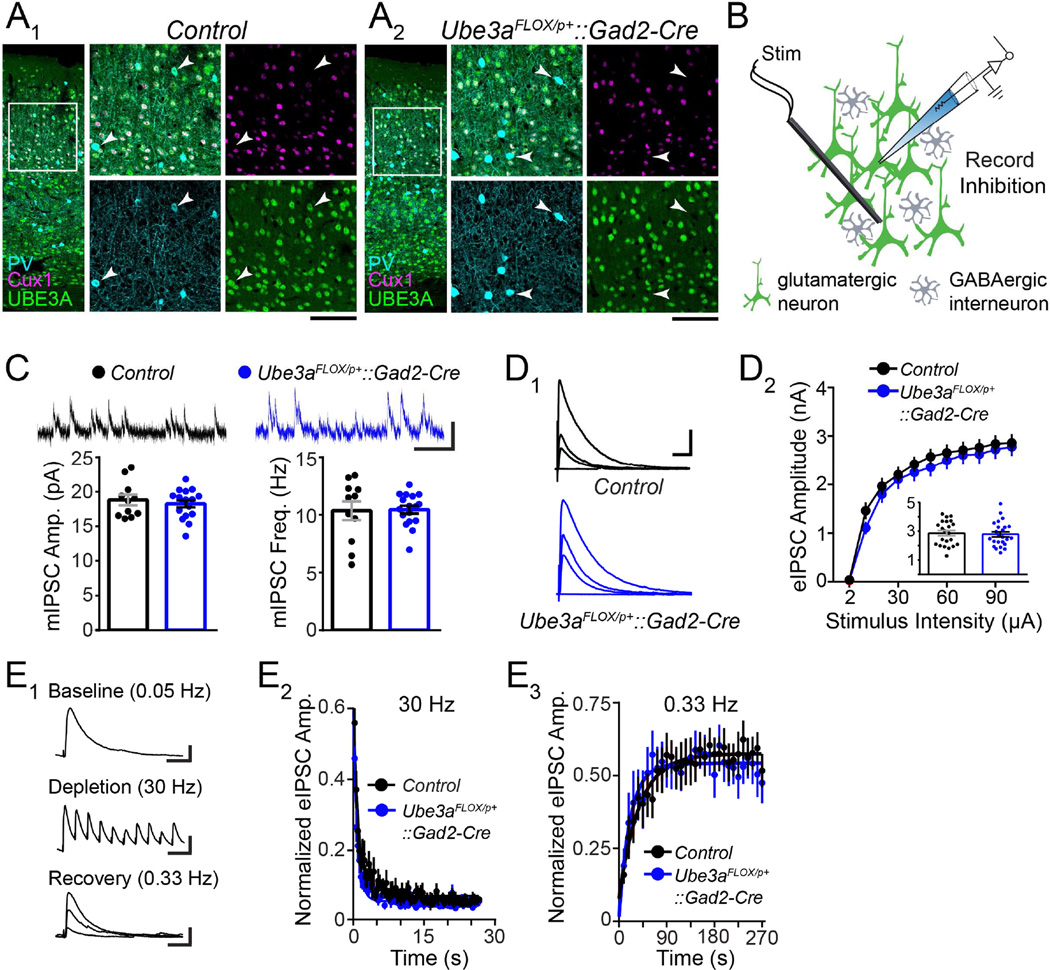
Figure 1. GABAergic Ube3a loss does not compromise synaptic inhibition onto L2/3 pyramidal neurons.
(A) Immunostaining of parvalbumin (PV), Cux1, and UBE3A in V1 of ~P80 Control (A1) and Ube3aFLOX/p+::Gad2-Cre (A2) mice. Arrowheads indicate PV-positive interneurons lacking UBE3A (scale bar = 145 µm or 75 µm for zoom-ins). (B) Schematic for recording synaptic inhibition onto L2/3 pyramidal neurons in V1 of ~P80 Ube3aFLOX/p+::Gad2-Cre mice (green shading indicates presence of UBE3A). (C) Sample recordings (scale bar = 20 pA, 200 ms) and quantification of mIPSC amplitude and frequency (Control n = 11 cells; Ube3aFLOX/p+::Gad2-Cre n = 17 cells). (D) Sample recordings of eIPSCs (D1) at stimulation intensities of 2, 10, 30, and 100 µA (scale bar = 1 nA, 40 ms). (D2) Quantification of eIPSCs. Inset depicts response amplitudes to 100 µA stimulation (Control n = 22 cells; Ube3aFLOX/p+::Gad2-Cre n = 24 cells). (E) Sample recordings (E1) depicting each phase of an inhibitory synaptic depletion and recovery experiment (scale bars: baseline = 200 pA, 20 ms; depletion = 200 pA, 70 ms; recovery = 200 pA, 20 ms). (E2) Average depletion phase showing eIPSC amplitude normalized to baseline during 800 stimuli at 30 Hz. Each point (80 plotted per genotype) represents 10 consecutive responses that were collapsed and averaged per cell. (E3) Average recovery phase showing eIPSC amplitude normalized to baseline during 90 stimuli at 0.33 Hz. Each point (30 plotted per genotype) represents 3 consecutive responses that were collapsed and averaged per cell. Average depletion and recovery responses for each genotype were fit with a monophasic exponential (Control n = 11 cells; Ube3aFLOX/p+::Gad2-Cre n = 9 cells). Data represent mean ± SEM.

