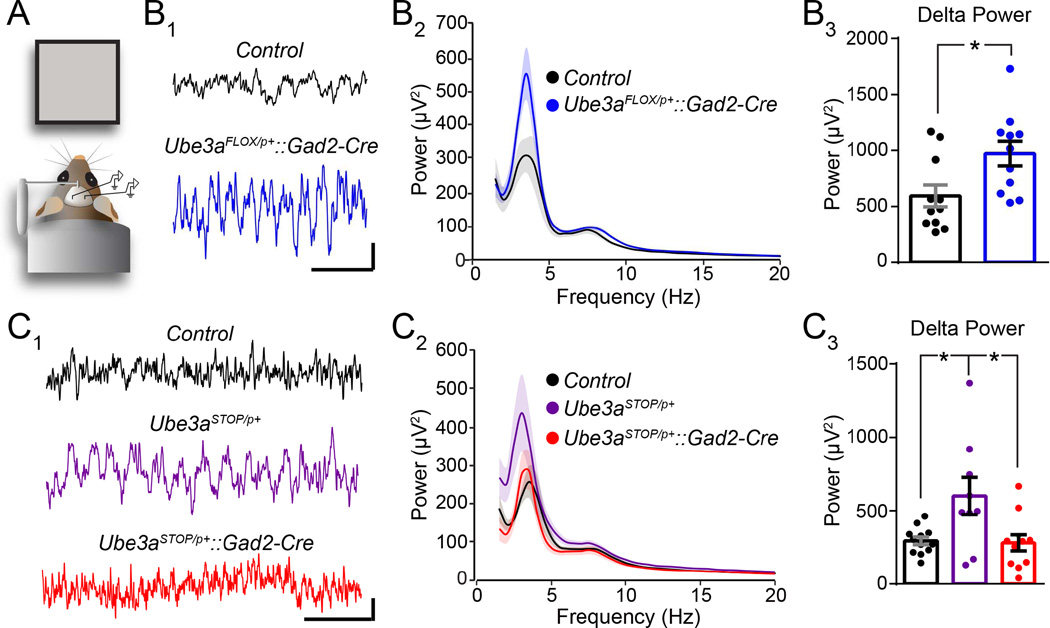
Figure 6. GABAergic Ube3a loss selectively enhances LFP spectral power in the delta band.
(A) Schematized configuration for local field potential (LFP) recordings in non-anesthetized mice. (B) Sample V1 LFP recordings (B1, scale bar = 100 µV, 1 s) and quantification of average spectral power (B2) from Control (n = 11) and Ube3aFLOX/p+::Gad2-Cre (n = 11) mice at ~P100. (B3) Quantification of the region (3–4 Hz) encompassing the largest genotypic difference in power within the delta band. (C) Sample V1 LFP recordings (C1, scale bar = 100 µV, 1 s) and quantification of average spectral power (C2) from from Control (n = 12), Ube3aSTOP/p+ (n = 9), and Ube3aSTOP/p+::Gad2-Cre (n = 11) mice at ~P100. (C3) Quantification of the region (2–3 Hz) encompassing the largest genotypic difference in power within the delta band. Data represent mean ± SEM. *p≤0.05.

