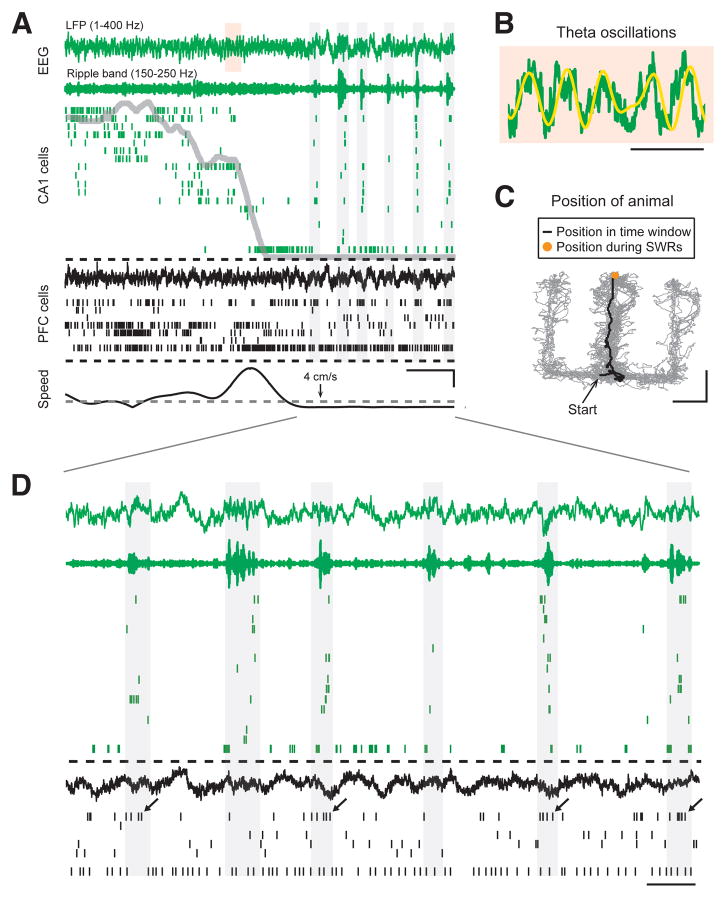
Figure 2. Two Distinct Network Activity Patterns in the Hippocampus During Behavior.
(A) Spike and local field potential (LFP) activity in CA1 region of the hippocampus (green) and PFC (black) as an animal approaches a reward well in the W-track spatial alternation task. From top to bottom, the plot shows respectively: broadband LFP (1–400 Hz) in CA1, ripple band filtered LFP (150–250 Hz) in CA1, raster plot with spikes from 18 CA1 place cells, broadband LFP in PFC, raster plot with spikes from 7 PFC neurons, and animal speed. Linear distance of the animal from the reward well is overlaid on the CA1 raster (grey line). The threshold speed, 4 cm/s, used to detect SWRs is indicated on the speed plot. Vertical gray rectangle backgrounds denote SWRs detected in CA1 LFP. Scale bars are 2 sec (horizontal), and 10 cm/s (vertical). (B) Shaded area over CA1 LFP from (A) on an expanded time scale. Theta filtered LFP (6–12 Hz) is shown overlaid with the broadband LFP. Scale bar = 250 ms.
(C) Position of the animal on the W-track as it approaches the center reward well and stops to consume reward. Scale bar = 20 cm.
(D) Time period marked by lines from (A) shown on an expanded time scale, illustrating activity in CA1 and PFC when the animal is stationary at the reward well. Note that one of the PFC neurons shows increased spiking during a subset of the hippocampal SWRs (marked by arrows). Scale bar = 500 ms.
See also Figure S2.

