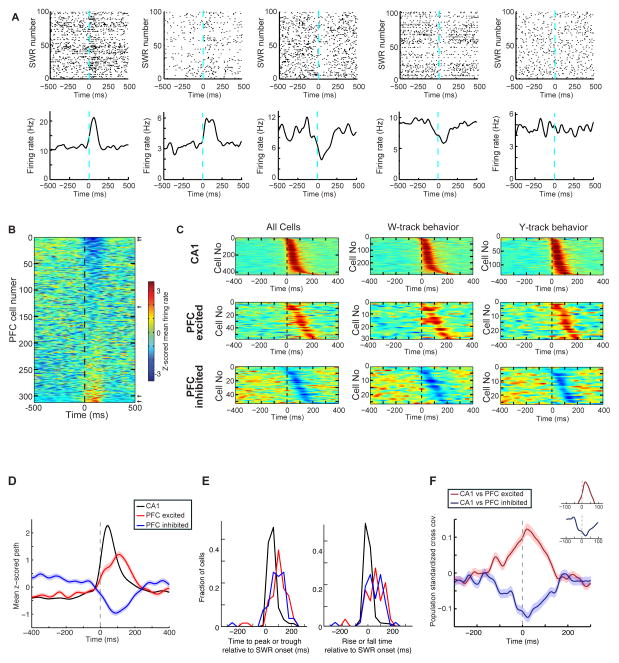
Figure 3. Modulation of PFC Neuronal Spiking During Awake Hippocampal SWRs.
(A) SWR-aligned rasters of example neurons (top), and corresponding average firing rates (bottom). Neurons in columns 1 and 2 showed strong excitation during SWRs (SWR-excited). Neurons in columns 3 and 4 were SWR-inhibited, and the neuron in column 5 was SWR-unmodulated (p’s < 10−3 for modulated neurons; p = 0.4 for unmodulated neuron.
(B) SWR-triggered mean firing of all PFC units. Each row shows the z-scored mean SWR-triggered firing of one neuron. Neurons are ordered by their firing amplitude in a 0–200 ms window after SWR onset. Arrows mark the location of example neurons shown in (A).
(C) Left, Population PSTHs for CA1, PFC SWR-excited and PFC SWR-inhibited cell populations sorted by the timing of the peak or trough in the SWR-modulated PSTH. Middle, Same plots for neurons recorded only on the W-track. Right, Same plots for neurons recorded only on the Y-track.
(D) Population-averaged SWR-triggered PSTHs for CA1, PFC SWR-excited and SWR-inhibited populations. Shaded areas are s.e.m.
(E) Left Distribution of the time of the peak of the SWR response for the populations in (D). Right Distribution of the onset rise / fall time of the SWR response for the populations in (D). Both SWR-excited and SWR-inhibited PFC populations had significantly later peaks/troughs and longer time to rise compared to the CA1 population (p’s < 0.001, rank-sum test).
(F) Mean standardized cross-covariance during SWRs for CA1 vs. SWR-excited pairs (n = 393), and CA1 vs. SWR-inhibited pairs (n = 320). Insets show area around peaks.
See also Table S2.

