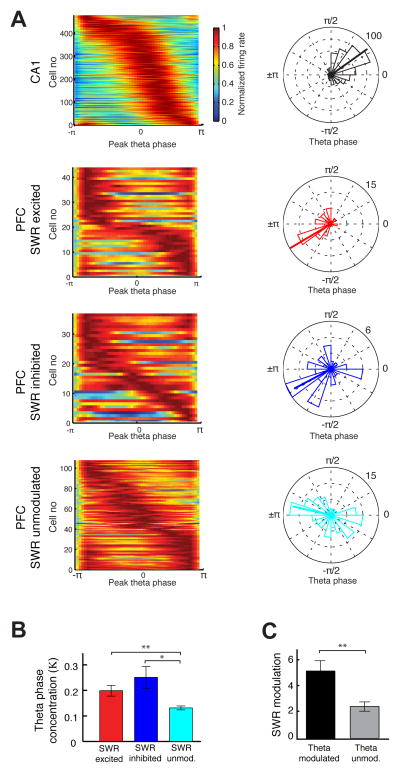
Figure 4. Phase Locking of PFC Neurons to Hippocampal Theta.
(A) Left Normalized firing rates as a function of CA1 theta phase. Each row in the color plot shows the normalized theta-phase aligned histogram of a neuron with significant phase-locking. The rows are sorted by peak theta phase of each neuron. Right Polar plots quantifying the distribution of peak phases for the populations shown on left. Numbers on top right indicate radius of the plot, the scale for number of neurons.
(B) Average concentration parameter (κ) quantifying strength of phase locking (*p < 0.01, **p< 0.001, rank-sum test).
(C) Average SWR modulation in theta modulated and theta unmodulated PFC populations (**p < 0.01, rank-sum test).
See also Table S3.

