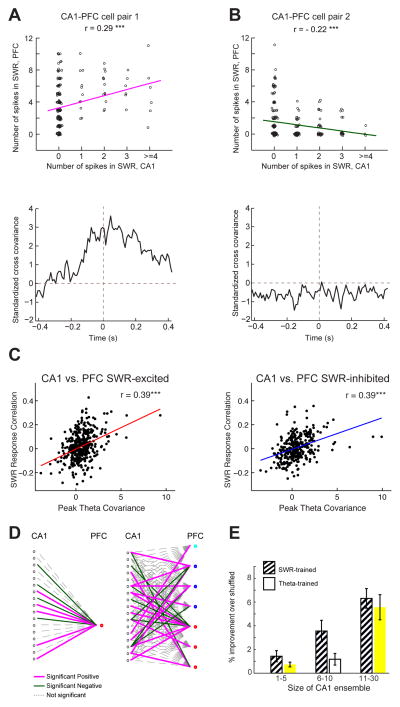
Figure 6. CA1-PFC Reactivation During Awake SWRs.
(A) Top, number of spikes across all SWRs of one PFC neuron against number of spikes of a simultaneously recorded CA1 neuron. Spike counts were jittered for visualization only (Gaussian jitter with s.d. = 0.05 for x-axis, and s.d. = 0.1 for y-axis). Bottom, standardized cross-covariance of the neuronal pair during theta (r = 0.29, p = 4.5e−5***).
(B) Same as in a, for a pair with negative SWR-correlation and low theta cross-covariance (r = −0.22, p = 0.0006***).
(C) Left SWR correlation vs. theta cross-covariance for CA1 vs. SWR-excited PFC cells (n = 393 pairs; r = 0.39, p < 10−4). Right SWR correlation vs. theta cross-covariance for CA1 vs. SWR-inhibited PFC cells (n = 320 pairs, r = 0.39, p < 10−4).
(D) Left A GLM obtained for an example CA1 ensemble and PFC cell, where spiking of the CA1 ensemble during SWRs was used to predict spiking of the PFC cell during SWRs. Edges represent GLM beta coefficients. Right The network from the left embedded within a larger network that includes the other PFC cells recorded simultaneously. Red dots represent SWR-excited PFC cells, blue dots represent SWR-inhibited PFC cells and cyan dots represent SWR-unmodulated PFC cells.
(E) Cross-validated prediction for SWR-associated spiking of PFC SWR-modulated cells. Prediction is plotted as a function of the CA1 ensemble size. SWR-trained (striped bars) prediction performance increased with the size of the CA1 ensemble (1-way ANOVA, cell count group: p< 10−4). Movement-trained (white bars) prediction performance also increased with the size of the CA1 ensemble (1-way ANOVA, cell count group: p< 10−7).
See also Figure S4.

