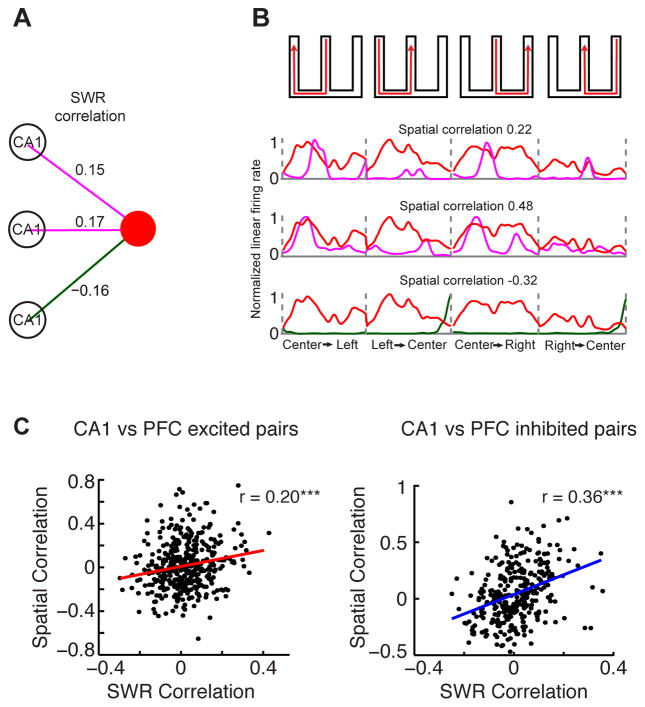
Figure 7. CA1-PFC Reactivation reflects Spatial Correlations.
(A) Example PFC neuron and three simultaneously recorded CA1 neurons. The purple and green lines represent significant positive and negative SWR-correlations, respectively. The corresponding SWR correlation coefficients are shown above their respective lines.
(B) Normalized linear firing rate of the corresponding CA1 neurons from (A) for each of the W-track spatial trajectories, overlaid on the PFC firing rate in red. The spatial correlation coefficients for these CA1-PFC pairs are shown above their respective linear firing rate maps.
(C) Spatial correlation vs. SWR correlation for (Left) CA1 vs. SWR-excited PFC cells (n = 393 pairs, r = 0.2, p < 10−3), and (Right) CA1 vs. SWR-inhibited PFC cells (n = 320 pairs; r = 0.36, p < 10−4). The SWR-inhibited population had stronger correlations than SWR-excited population, p < 0.01, shuffle test, n = 1000).
See also Figures S5 and S6.

