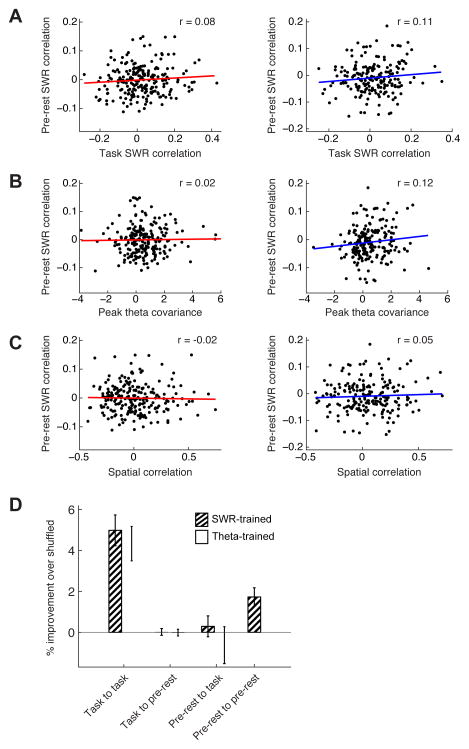
Figure 8. Task Related CA1-PFC Correlations are Not Present in Preceding Rest Periods.
(A) SWR response correlation in pre-rest vs. task behavior for all CA1-PFC pairs recorded in both epochs for W-track behavior. (Left) CA1-PFC SWR excited pairs (n = 219, r = 0.08, p = 0.2). (Right) CA1-PFC SWR inhibited pairs (n = 196, r = 0.1, p > 0.1).
(B) SWR response correlation vs. peak theta cross-covariance during task behavior vs. during pre-rest periods. (Left) CA1-PFC SWR excited pairs (n = 219, r = 0.02, p > 0.8). (Right) CA1-PFC SWR inhibited pairs (n = 196, r = 0.12, p > 0.1).
(C) Pre-rest SWR response correlation vs. spatial correlation during behavior. (Left) CA1-PFC SWR excited pairs (n = 219, r = −0.02, p > 0.7). (Right) CA1-PFC SWR inhibited pairs (n = 196, r = 0.05, p > 0.5).
(D) Comparison of cross-validated GLM models for prediction of SWR-associated spiking of PFC cells using CA1 cell activity. Task to task: Behavior model to predict behavioral data (n = 38 PFC SWR-modulated cells). Task to pre-rest: Behavior model to predict pre-rest data (n = 24 cells). Prediction was significantly lower than run-to-run performance (SWR-trained: ranksum test, n = 38 vs. n = 24 cells, p < 10−6 ; Theta-trained: p < 10−5). Pre-rest to task: Pre-sleep model to predict behavioral data (n = 22 cells). Prediction was significantly lower than run-to-run performance (SWR-trained: ranksum test, n = 38 vs. n = 22 cells, p < 10−6 ; Theta-trained: p < 10−4). Pre-rest to pre-rest: Pre-rest model to predict pre-rest data (n = 39 cells). Prediction was significantly higher than either of the two cross-epoch predictions (SWR-trained: ranksum test, n = 39 vs. n = 24 cells, p < 0.01; n = 39 vs. n = 22 cells, p < 0.01).
See also Figure S7.

