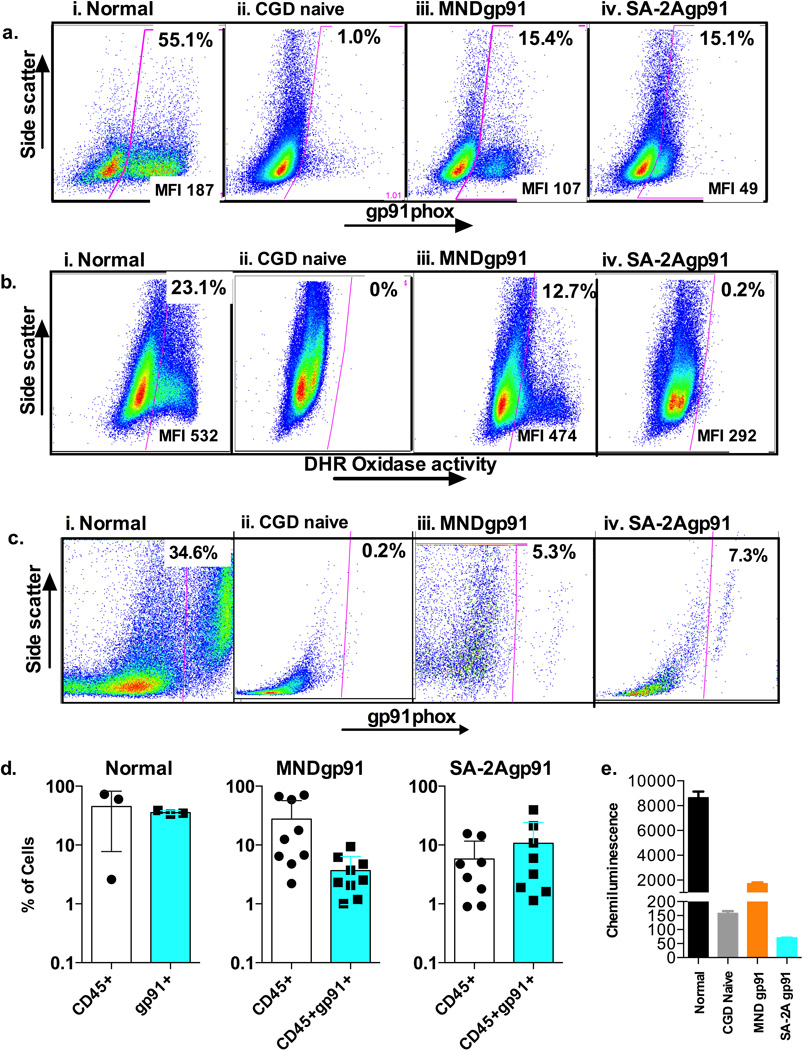
Figure 4. AAVS1 specific ZFN and AAV6 donor mediated targeted insertion of gp91phox corrective gene into human CD34+ HSCs from patients with X-linked chronic granulomatous disease (X-CGD).
a) Flow cytometry analysis of gp91phox expression in 7 day cultured untreated healthy human donor HSCs (normal), untreated XCGD patient HSCs (CGD naïve), ZFN plus AAV6-MND-gp91 TI treated XCGD patient HSCs (MNDgp91), and ZFN plus AAV6-SA-2A-gp91 TI treated XCGD patient HSCs (SA-2Agp91). Indicated at the top of the gated area of each panel is the percent of gp91phox positive cells, where the mean fluorescence intensity (MFI) indicates the average per cell expression of gp91phox positive cell.
b) Flow cytometry dihydrorhodamine (DHR) analysis of NADPH oxidase activity in 14 day cultured untreated healthy human donor HSCs (normal), untreated XCGD patient HSCs (CGD naïve), ZFN plus AAV6-MND-gp91 TI treated XCGD patient HSCs (MNDgp91), and ZFN plus AAV6-SA-2A-gp91 TI treated XCGD patient HSCs (SA-2Agp91). Indicated at the top of the gated area of each panel is the percent of oxidase positive cells, where the mean fluorescence intensity (MFI) indicates the average per cell oxidase activity per positive cell.
c) Flow cytometry analysis of gp91phox expression of the human CD45+ cells in bone marrow from NSG mice 8 weeks after transplant of untreated healthy human donor HSCs (normal), untreated XCGD patient HSCs (CGD naïve), ZFN plus AAV6-MND-gp91 TI treated XCGD patient HSCs (MNDgp91), and ZFN plus AAV6-SA-2A-gp91 TI treated XCGD patient HSCs (SA-2Agp91). The gp91phox expression in culture cells before transplant is as shown in Fig 2a. Indicated at the top of the gated area of each panel is the percent of gp91phox positive cells.
d) Bar graph summary of flow cytometry analysis of the level of human cell engraftment (CD45+) and percent of the human CD45+ cells expressing gp91phox (CD45+gp91+) in bone marrow of mice transplanted with untreated healthy human donor HSCs (normal) (n=3), ZFN plus AAV6-MND-gp91 TI treated XCGD patient HSCs (MNDgp91) (n=9), and ZFN plus AAV6-SA-2A-gp91 TI treated XCGD patient HSCs (SA-2Agp91) (n=9). The average % is shown at the top of each bar.
e) Functional correction in X-CGD patient CD34+ progenitors. Bar graph summary of phorbol myristate acetate stimulated chemiluminescence detection of reactive oxidative species production from similarly in vitro cultured CD34+ progenitors differentiated into myeloid cells over × days in culture from a normal donor (N), untreated XCGD patient HSCs (CGD naïve), ZFN plus AAV6-MND-gp91 TI treated XCGD patient HSCs (MNDgp91), and ZFN plus AAV6-SA-2A-gp91 TI treated XCGD patient HSCs (SA-2Agp91). The mean chemiluminescence intensity units are shown at the top of each bar.

