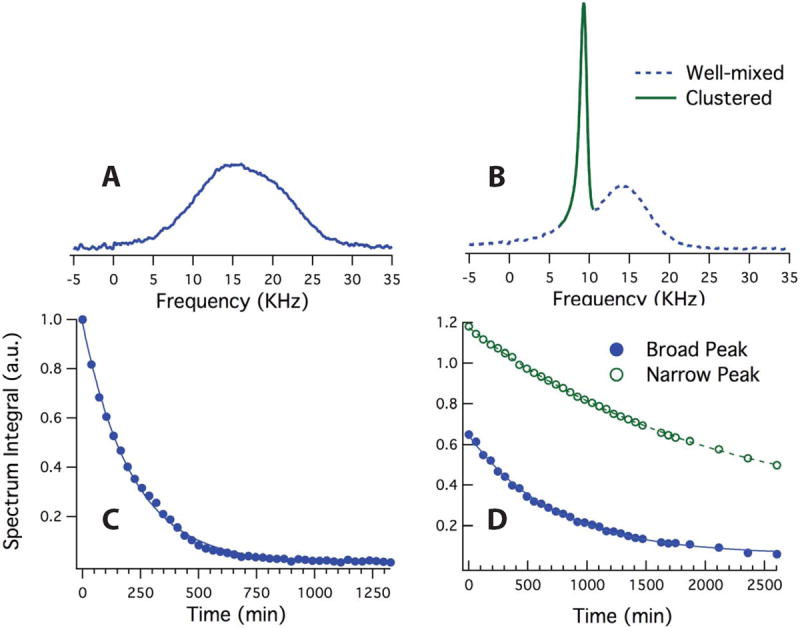
Figure 6.

129Xe NMR spectra and area under the peaks acquired from sample II after 9 hours of DNP at 1.42K before (A,C) and after (B,D) controlled annealing. (C) shows the area under the peak in (A) during relaxation. The solid line is the exponential fit to the data indicating a T1 of 212±3 minutes. (D) shows the area under the broad (filled circles) and narrow (open circles) peaks during relaxation. The exponential fits yield T1 relaxation times of 708±17 minutes and 2087±45 minutes for the broad and narrow peaks, respectively.
