Fig. 8.
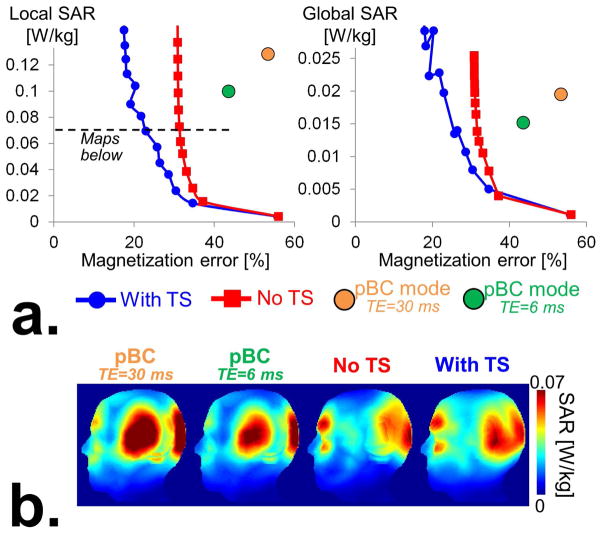
a: L-curves showing the tradeoff between local SAR and the magnetization error (expressed in percent of the target magnetization) for 1-spoke pulses computed with (“With TS”) and without optimization of the sub-pulse time-shifts (“Without TS”). Also shown are data points corresponding to pseudo-birdcage mode excitations (“pBC mode”) obtained with TE=30 ms and TE=6 ms. Note that the SAR of the pBC mode data points obtained for TE=6 ms and TE=30 ms are slightly different because the RF amplitudes are scaled so as to reach the average magnetization target. Since the pBC mode image for TE=30 ms has a large signal drop-out region in the frontal lobe, this scaling factor is greater for the TE=30 ms image than for the TE=6 ms image, which results in greater SAR. b: Maximum intensity projections of SAR maps of the “With TS”, “No TS” and birdcage mode excitation strategies. These results show that joint optimization of the spokes amplitudes and sub-pulse time-shifts (“With TS”) yields pulses with significantly better excitation profiles (see Fig. 5) than excitations only optimized for spoke amplitudes (“No TS”) for the same local SAR.

