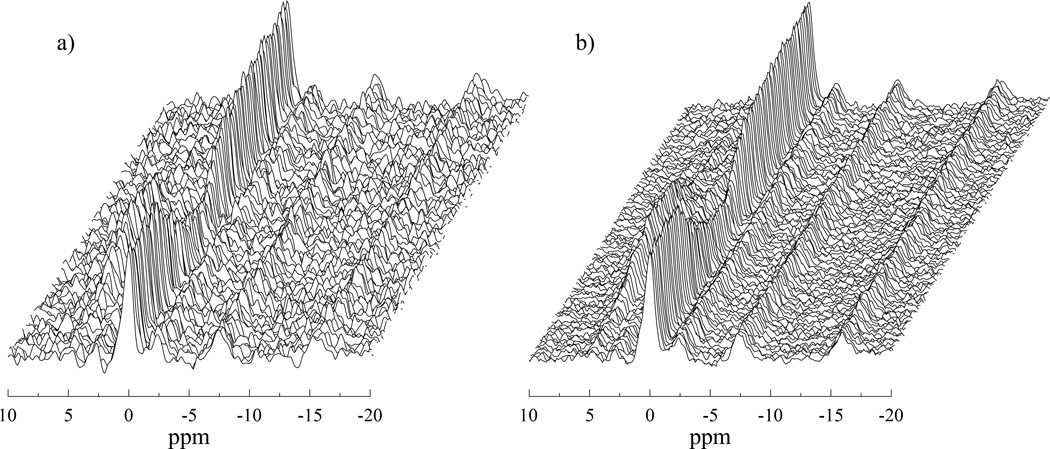
Figure 3.
Stack plots of 300 muscle 31P MR spectra from the entire exercise protocol. Panel (a) displays the data processed with the standard methods and, panel (b) the same data with the SIFT method applied. There is a great improvement in the SNR and the temporal trajectories of the peaks are much smoother in the SIFTed data.

