Figure 4.

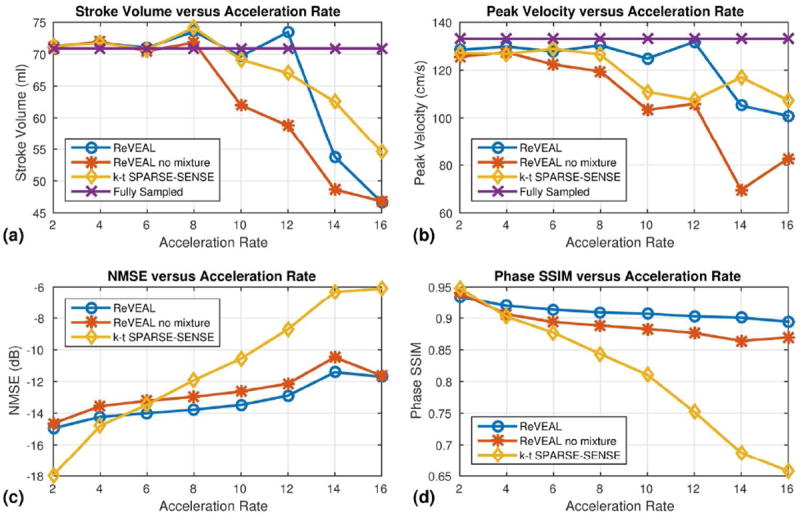
A summary of retrospectively accelerated in vivo data quality metrics. A fully sampled through-plane image of the ascending aorta was acquired and retrospectively accelerated for rates R = 2, 4, 6, 8, 10, 12, 14, and 16. ReVEAL, ReVEAL no mixture, and k-t SPARSE-SENSE are compared to fully sampled data. (a) The stroke volume in the ascending aorta versus acceleration rate. (b) The peak velocity in the ascending aorta versus acceleration rate. (c) The normalized mean squared error (NMSE) in dB versus acceleration rate. The images used to calculate NMSE were obtained by forming a complex number with magnitude equal to the compensated image magnitude, i.e. |xb|, and phase equal to the velocity encoded phase, i.e. θυ. (d) The structural similarity index (SSIM) (42) for the velocity encoded phase image versus acceleration rate. The phase SSIM measurement was performed only on pixels within the top 95% of magnitude value in the reference image.
