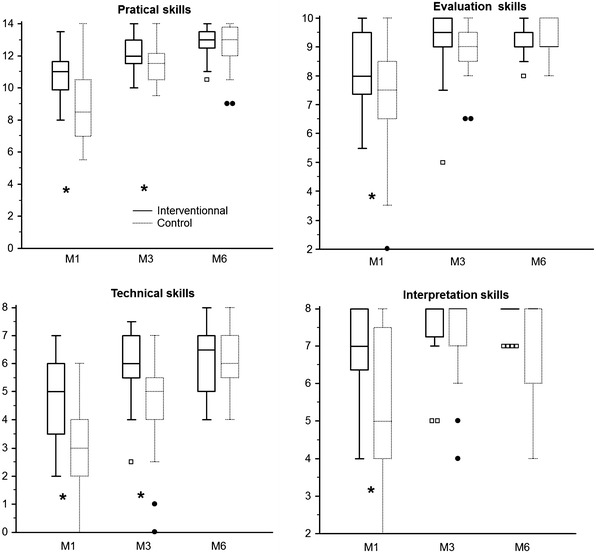
Fig. 2.

Box and whisker plot representation of the score (y axis) obtained in each part of the scoring system at 1 (M1), 3 (M3) and 6 months (M6) in the interventional and control groups. Median = horizontal line inside the box; upper and lower quartiles = whisker plot; boxes and circles represent values lower than the lower quartiles. *p < 0.05
