Figure 4.

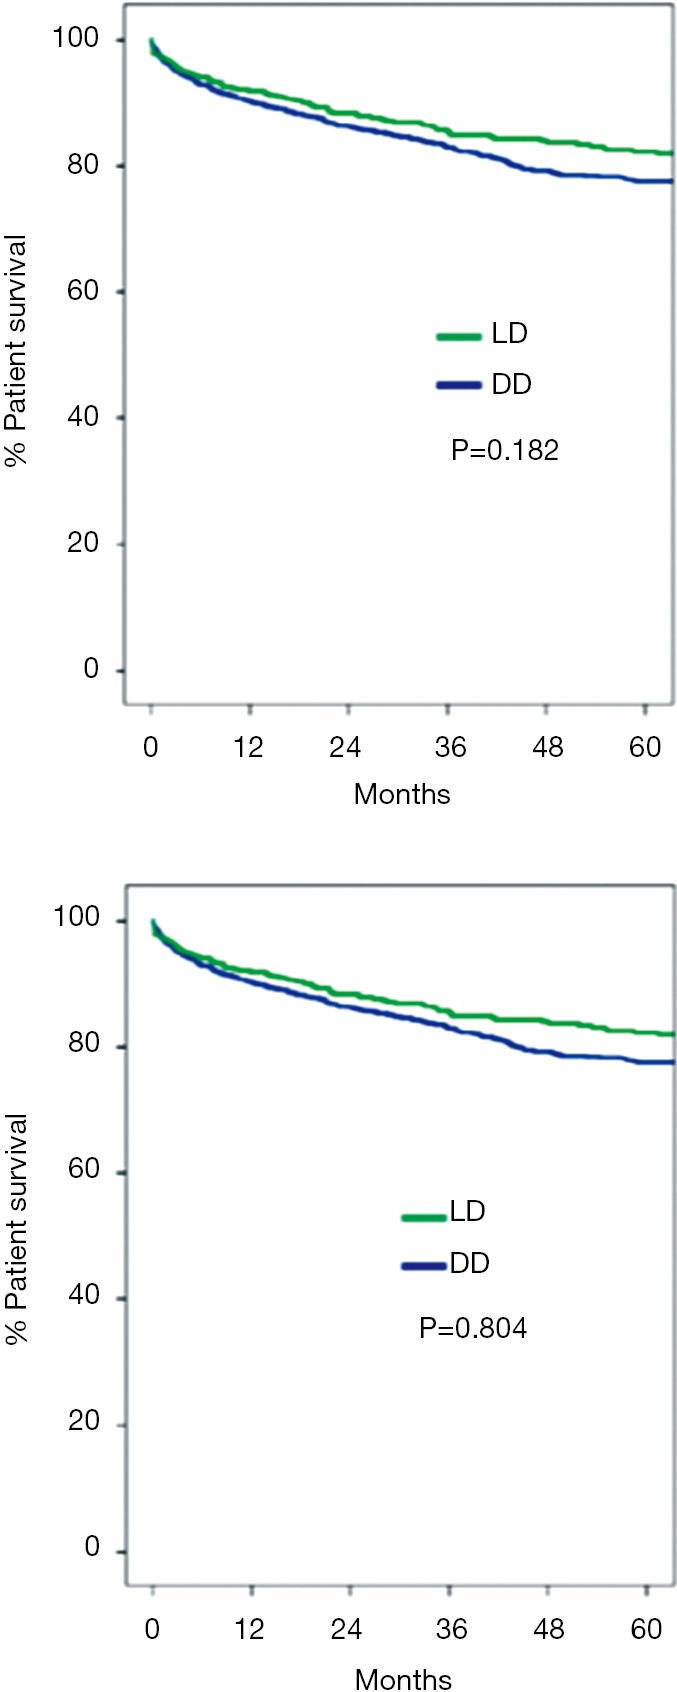
Patient and graft survival. Kaplan-Meier survival curves were calculated for the 474 LDLT and 1,244 DDLT that were performed between April 2000 and May 2014. LD, living-donor; DD, deceased-donor.

Patient and graft survival. Kaplan-Meier survival curves were calculated for the 474 LDLT and 1,244 DDLT that were performed between April 2000 and May 2014. LD, living-donor; DD, deceased-donor.