Figure 2.

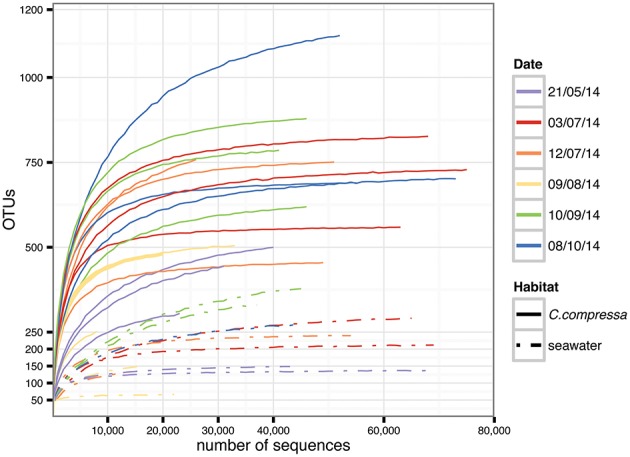
Rarefaction curves generated for each sample. Solid and dot-dash lines refer to Cystoseira compressa and seawater samples, respectively. Colors represent different time points.

Rarefaction curves generated for each sample. Solid and dot-dash lines refer to Cystoseira compressa and seawater samples, respectively. Colors represent different time points.