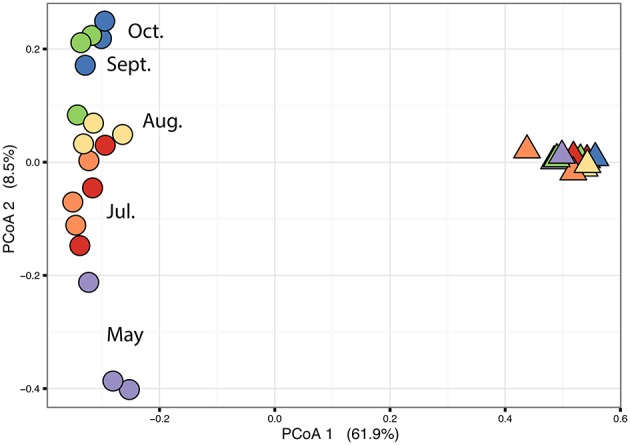
Figure 6.

Principal coordinate analysis plot (PCoA) based on a Bray-Curtis distance matrix calculated from the square-root transformed OTU abundance data of the bacterial community of C. compressa and surrounding seawater across times. Violet, red, orange, yellow, green, and blue points represent the following sample times respectively: 21-05-14, 03-07-14, 12-07-14, 09-08-14, 10-09-14, and 08-10-14.
