Figure 7.

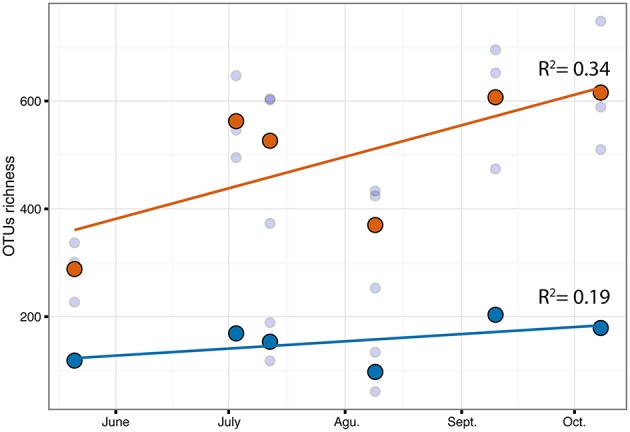
Correlation of OTUs richness over time for C.compressa (orange dots) and seawater (blue dots). Dots and lines are mean values and tendency respectively. Values of Pearson correlation (R2) are shown inside the plot.

Correlation of OTUs richness over time for C.compressa (orange dots) and seawater (blue dots). Dots and lines are mean values and tendency respectively. Values of Pearson correlation (R2) are shown inside the plot.