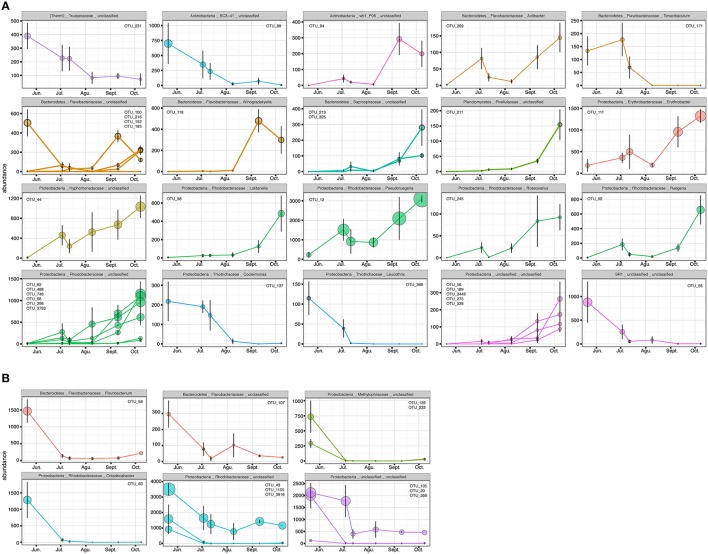
Figure 8.
OTUs with higher Pearson correlation (>0.6) in their abundance over time, contributing to the differences in the epiphytic bacteria of C. compressa (A) and surrounding seawater (B) between time 1 and 6 (May-October). The OTUs are grouped by phylum, family and genus. OTUs number are reported inside each graph.

