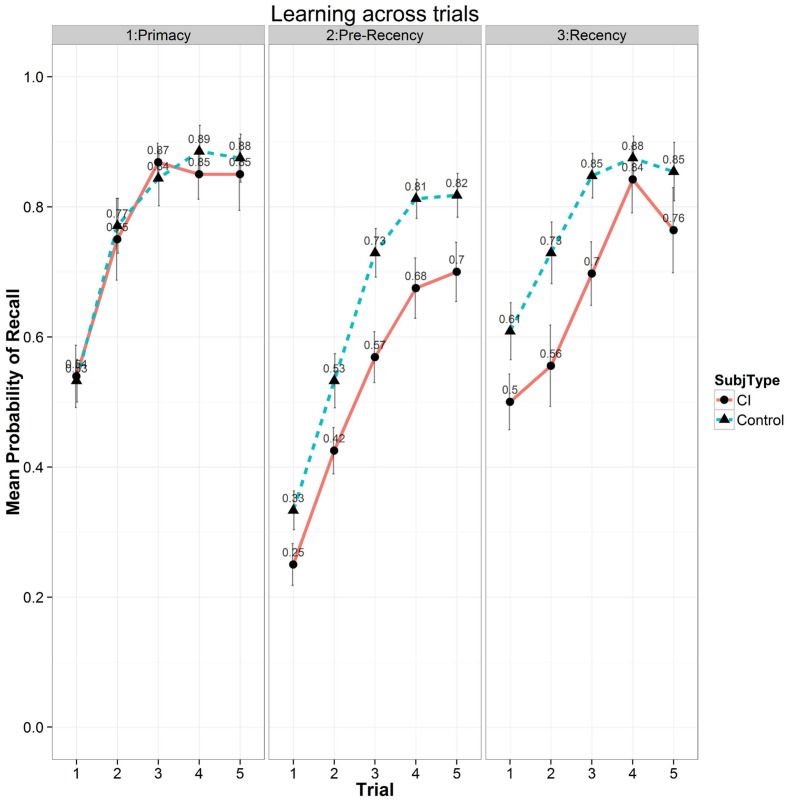
FIGURE 6.
Mean probability of correct recall as a function of the five repetition learning trials for List A on the CVLT-II for the three subcomponents of the conventional serial position curve. Scores for the primacy portion of the serial position curve are shown on the (Left), scores for the pre-recency (middle) position of the serial position curve are shown in the (Center), and scores for the recency portion are shown on the (Right). Results for the CI users are shown by solid bars and circles; results for the normal-hearing controls are shown by dashed bars and triangles.

