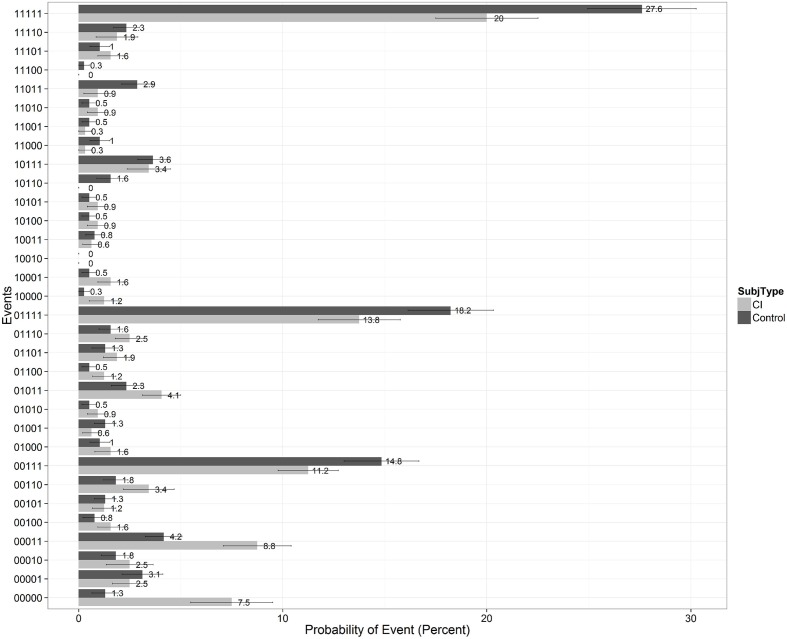
FIGURE 7.
Recall patterns showing the probability of the 32 possible recall-events collapsing across all subjects and items for the five learning trials of List A on the CVLT-II. Scores for the CI users are shown by the light gray bars on the right of each column; scores for the normal-hearing controls are shown by the black bars on the left of each column. A “00000” denotes that a specific test item was never recalled on any of the five learning trials of List A; a “11111” denotes that a specific test item was correctly recalled on every trial, and so on.

