
FIGURE 1.
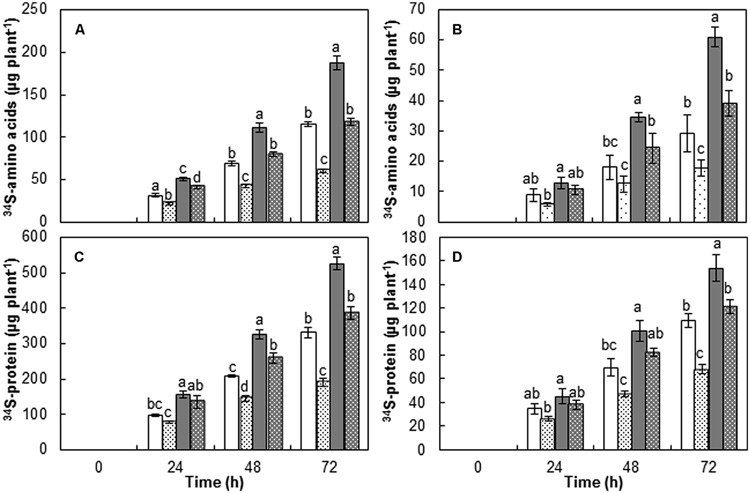
Amount of S assimilated into amino acids and proteins in leaves (A,C) and roots (B,D) of cultivars Mosa (white bar) or Saturnin (dark gray bar) under control (non-dotted bar) or PEG-induced drought stress (dotted bar) conditions for 72 h. Data are presented as mean ± SE for n = 3. Means denoted by the different letter are significantly different at P < 0.05 according to the Duncan’s multiple range test.