
FIGURE 2.
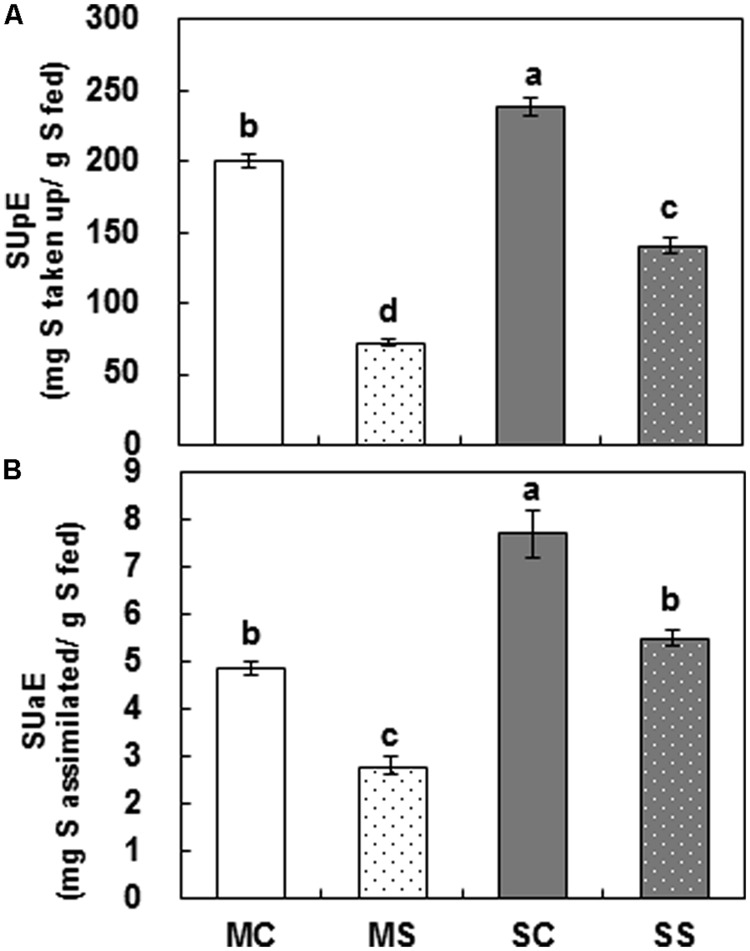
Sulfur use efficiency based on S uptake (SUpE) (A) and S assimilation (SUaE) (B) of cultivars Mosa (white bar) or Saturnin (dark gray bar) under control (non-dotted bar) or PEG-induced drought stress (dotted bar) conditions at 72 h. Data are presented as mean ± SE for n = 3. Means denoted by the different letter are significantly different at P < 0.05 according to the Duncan’s multiple range test.