
FIGURE 3.
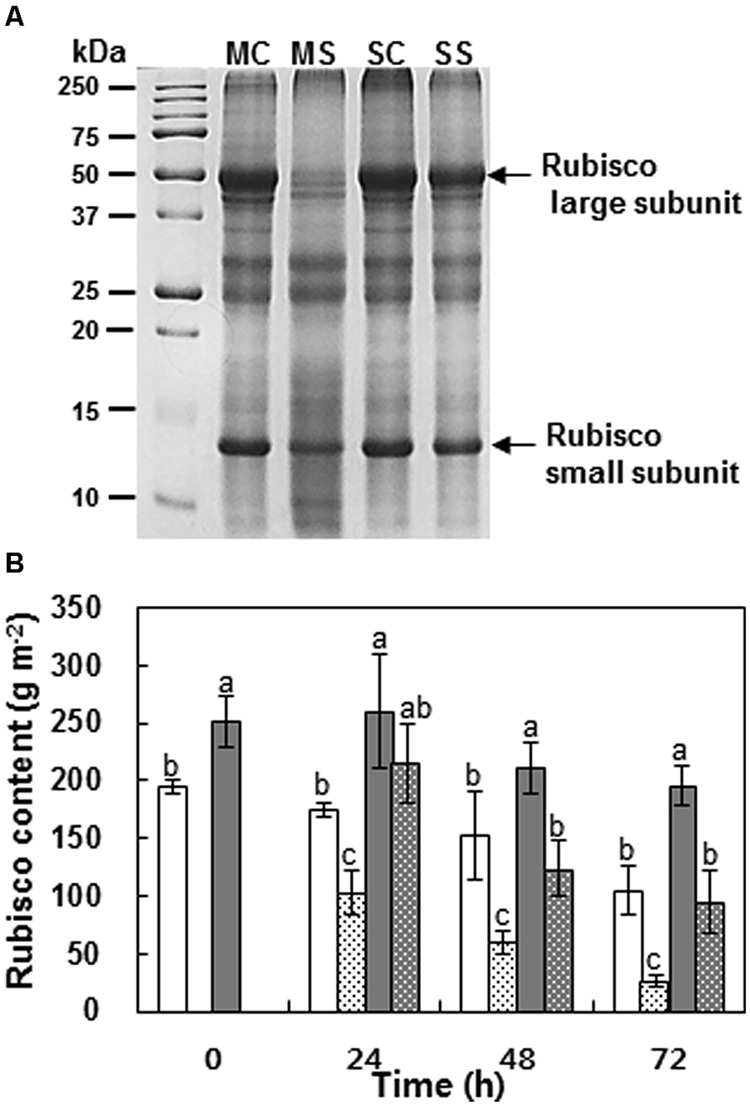
Leaf protein pattern after SDS–PAGE of cultivars Mosa (M) and Saturnin (S) at 72 h after control (MC or SC) and PEG-induced drought stress (MS or SS) treatment (A). Changes in Rubisco protein content (B) of leaves of Mosa (white bar) or Saturnin (dark gray bar) under control (non-dotted bar) or PEG-induced drought stress (dotted bar) conditions for 72 h. Data are presented as mean ± SE for n = 3. Means denoted by the different letter are significantly different at P < 0.05 according to the Duncan’s multiple range test.