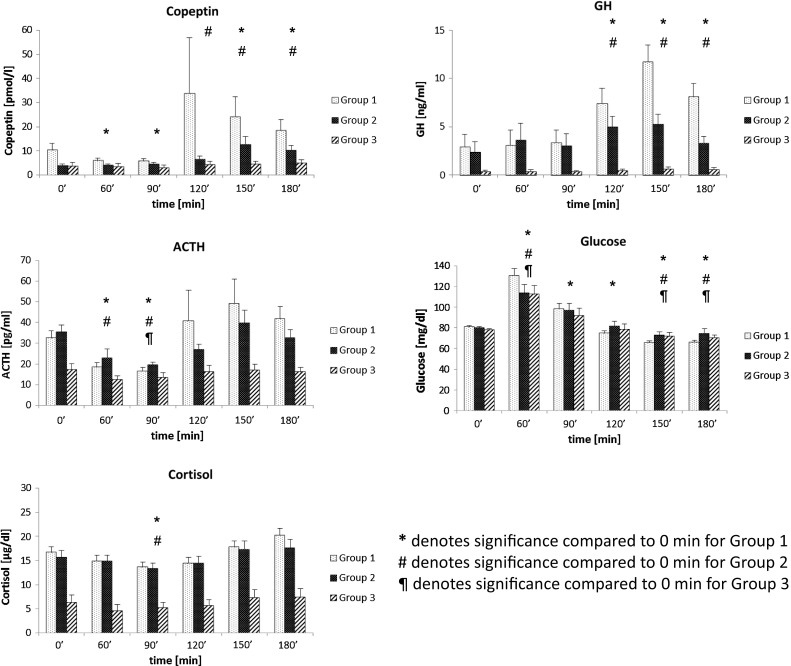
Fig. 1.

ACTH, Copeptin, and Growth Hormone concentrations during a glucagon stimulation test (GST). Patients were subdivided into Group 1 (healthy controls, n = 32), Group 2 (history of pituitary disease, but passed GST, n = 29), and Group 3 (unsatisfactory response during GST for GH, cortisol, or both, n = 18). Vertical lines denote standard errors of the means (SEMs)
