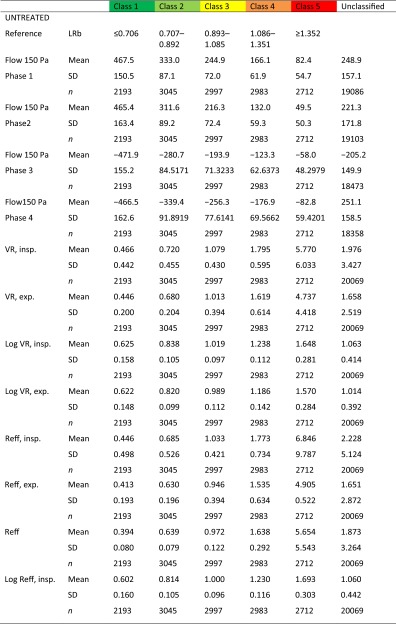
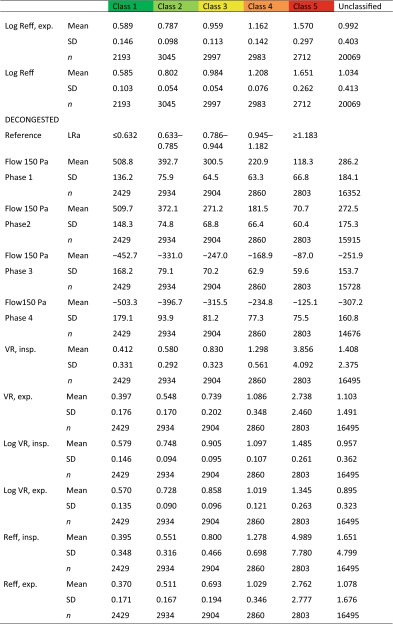
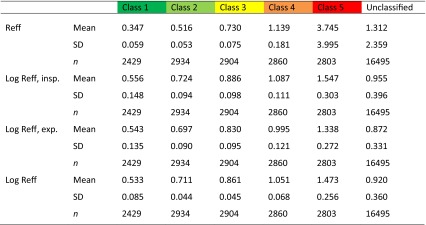
Table 1.
Descriptive statistics of 36,563 classified and non-classified measurements
The classes are corresponding to 20 % percentiles of the population (see Fig. 9a, b)
exp. expiration, insp. inspiration, Reff effective resistance, SD standard deviation, VR vertex resistance


