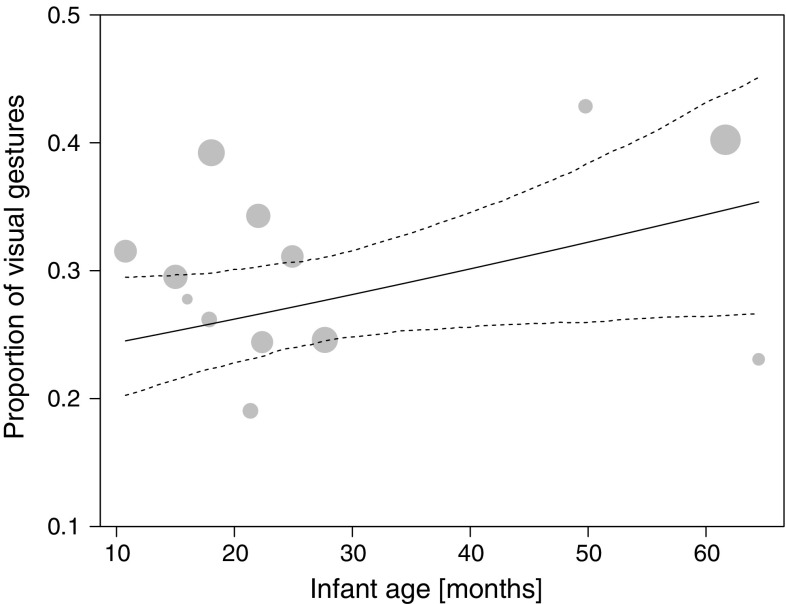
Fig. 3.
Proportion of visual gestures employed to initiate joint travel as a function of infant age. Depicted are proportions, separately for each dyad against the respective mean infant age. The area of the dots corresponds to the signal sample size per mother–infant dyad (range 20–171); the solid and dashed line(s) represent the fitted model and confidence intervals based on all covariates and factors centred to a mean of zero

