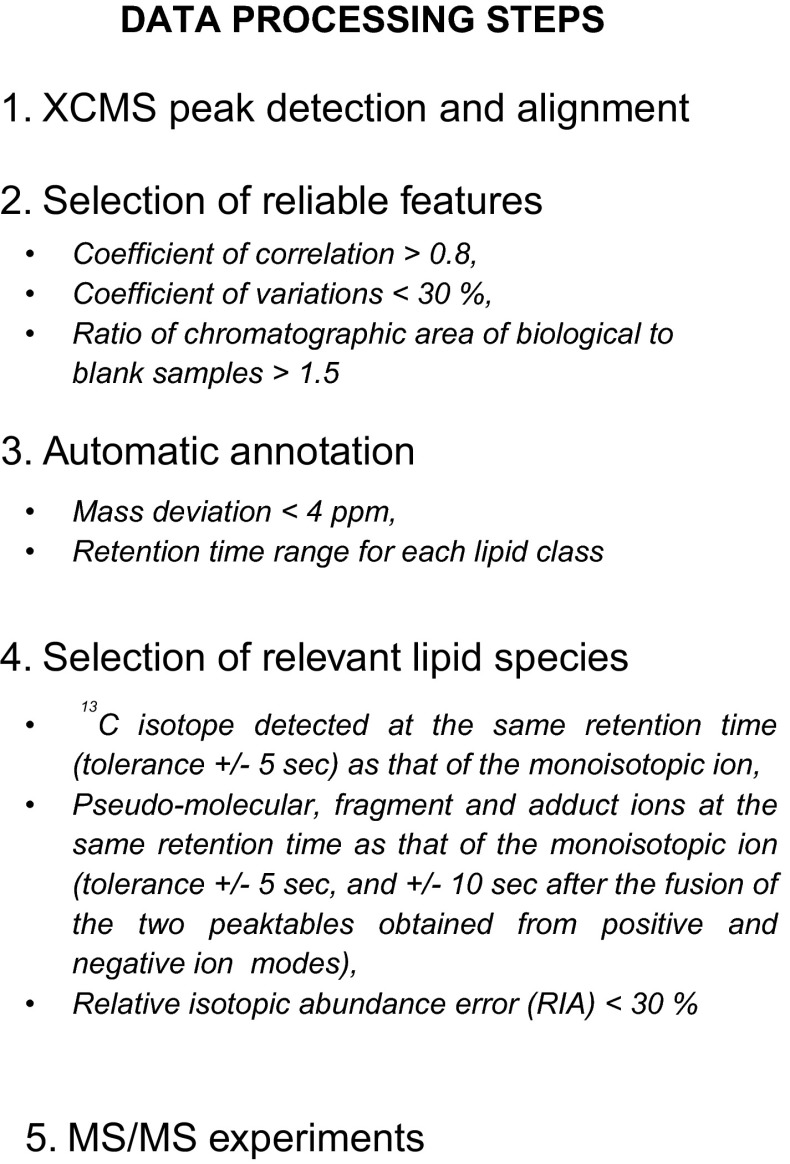
Fig. 2.
The data processing workflow. Features were filtered according to the following criteria: (i) the coefficients of correlation between dilution factors of QC samples (by factors of 1, 2, 4 and 8) and areas of chromatographic peaks (above 0.8), (ii) the coefficients of variation of areas of chromatographic peaks related to features detected in QC samples (less than 30 %) and (iii) the ratio of chromatographic areas of biological to blank samples (more than a factor of 1.5). Features were then annotated using a spectral database on the bases of exact masses and retention time windows specific to each lipid family. Each unique lipid species must be detected by XCMS/CentWave with at least its corresponding 13C isotope, and eventually fragment and adduct ions, which must be eluted at the same retention time as that of the pseudo molecular ion (with a tolerance of ±5 s, and ±10 s after the fusion of the two peaktables obtained in the positive and negative ion modes). Finally, each lipid species must have a RIA error below 30 %

