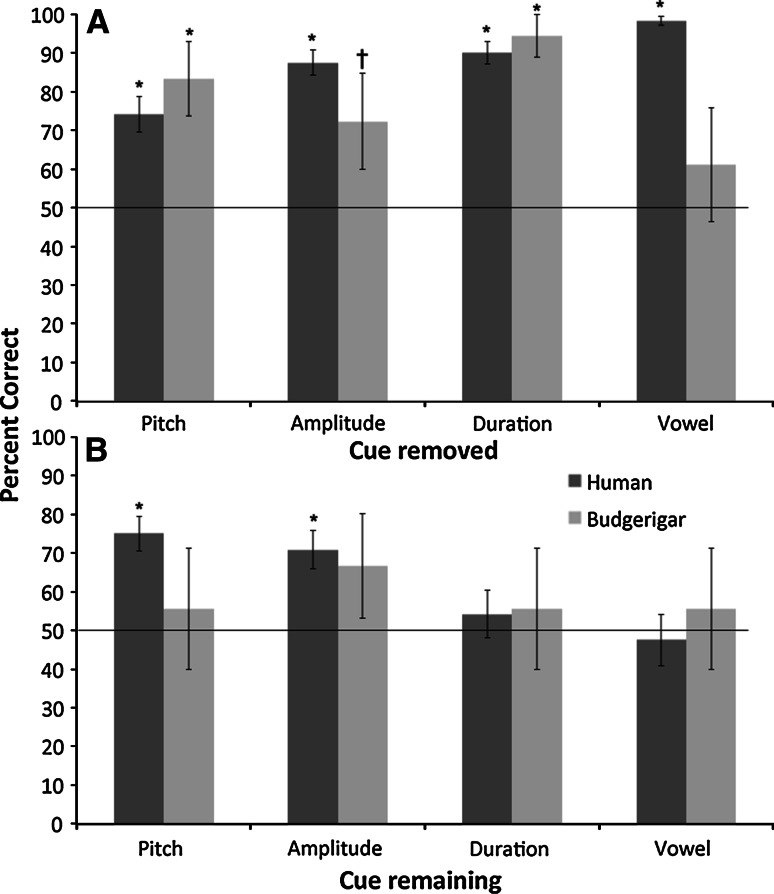
Fig. 4.
Percent correct for each manipulated stimulus category for each species. Panel a shows the manipulated stimuli with one cue removed. Panel b shows the manipulated stimuli with only one cue remaining. The line across each graph represents chance. Error bars show standard error of the mean. Stars show bars that are significantly above chance. *Two-tailed significance, †one-tailed significance

