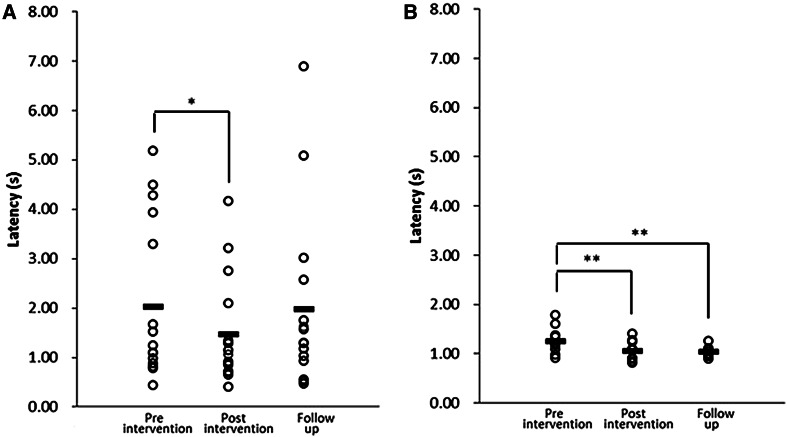
Fig. 2.
The latency of the swallowing response in elderly (a) and young (b) participants. Horizontal bars represent the mean value (n = 16 at pre- and post-intervention time points in the elderly group, n = 15 at the follow-up time point in the elderly group, and n = 10 at each time point in the young group). Asterisks indicate a significant difference between the time points (*p < 0.10, **p < 0.05). Statistical analyses were performed using a bootstrap test

