
Fig. 3.
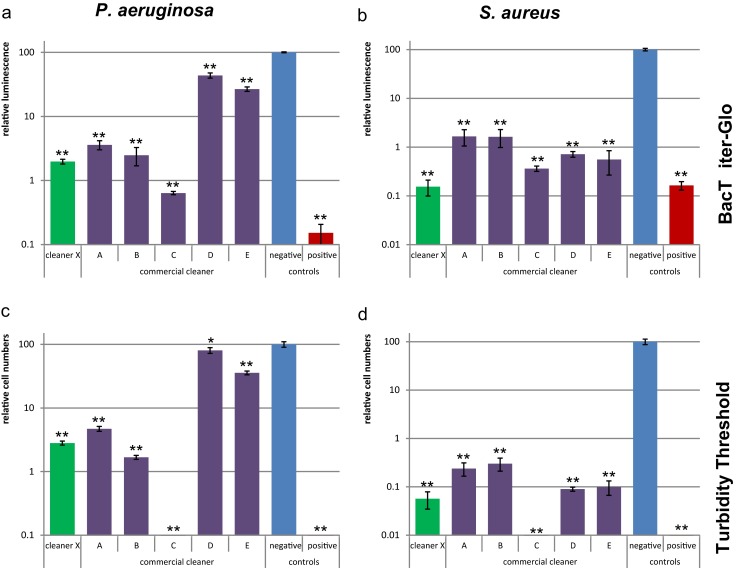
Quantification of viable cells. P. aeruginosa (a, c) and S. aureus (b, d) biofilms were treated with different cleaners. The viable cells were quantified by ATP detection with BacTiter-Glo reagent (a, b) and regrowth in the Turbidity Threshold method (c, d). The Y-axis represents the cell numbers relative to the negative control. Error bars are generated from six replicas. A t test was applied to each cleaner treatment compared to the negative control to calculate if the differences are statistically significant (one asterisk, p < 0.05) or highly significant (two asterisks, p < 0.001)