
Fig. 4.
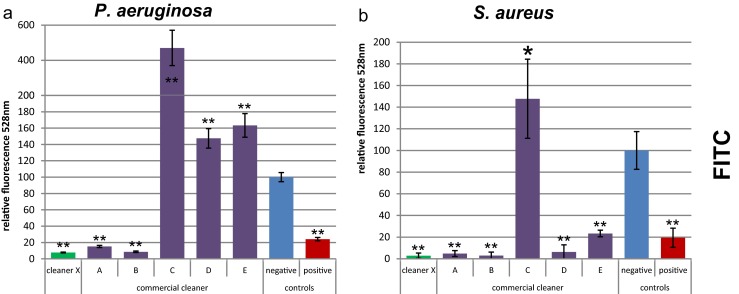
Quantification of biofilm protein by FITC staining. P. aeruginosa (a) and S. aureus (b) biofilms were treated with different cleaners. The Y-axis represents the fluorescent signal values relative to the negative control. Error bars are generated from six replicas. A t test was applied to each cleaner treatment compared to the negative control to calculate if the differences are statistically significant (one asterisk, p < 0.05) or highly significant (two asterisks, p < 0.001)