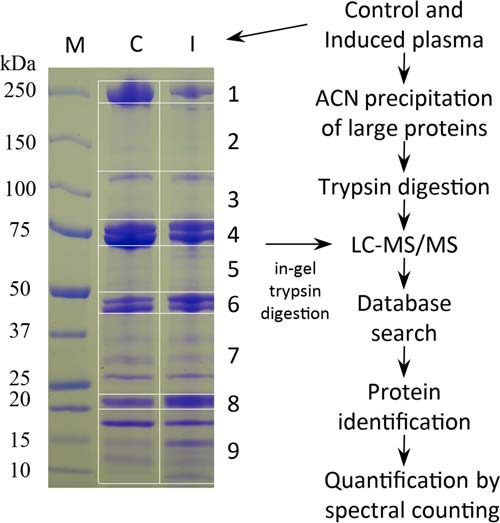
Fig. 1.

Schematic overview of sample preparation and data analysis. The control and induced plasma samples were separated by SDS-PAGE on a gradient gel that was later cut into nine pieces. Proteins in the gel slices were treated with trypsin and analyzed by nanoLC-MS/MS. As reported previously (24), the same plasma samples were treated with 50% ACN and proteins in the supernatants were analyzed. Protein identification and quantification were performed as described in the Materials and Methods.
