Fig. 3.
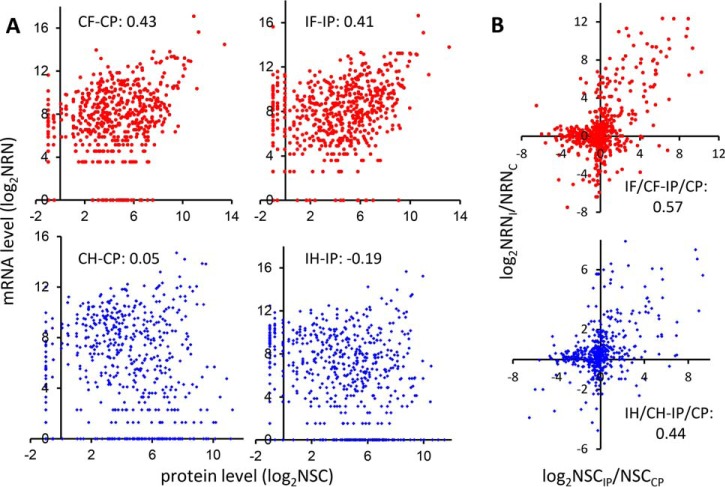
Correlation of the mRNA and protein abundances (A) and their changes (B) for gel-fractionated samples. (A) Levels. Upper panels: normalized read numbers (NRNs, y-axis) of specific transcripts in the control (CF, left) and induced (IF, right) fat body (red dot) and their corresponding normalized spectral counts (NSCs, x-axis) in the control (CP, left) and induced (IP, right) plasma are plotted in log2 scale, representing the relative mRNA and protein levels, respectively. Lower panels are the same as upper panels, except that the NRNs of mRNA in the control (CH, left) and induced (IH, right) hemocytes (blue dot) are shown. (B) Ratios. The mRNA and protein level changes are represented by NRNI/NRNC of fat body (red dot, upper panel) or hemocytes ((blue dot, lower panel) and NSCIP/NSCCP of plasma in log2 scale, respectively. The correlation coefficients for all the comparisons are indicated in the panels.

