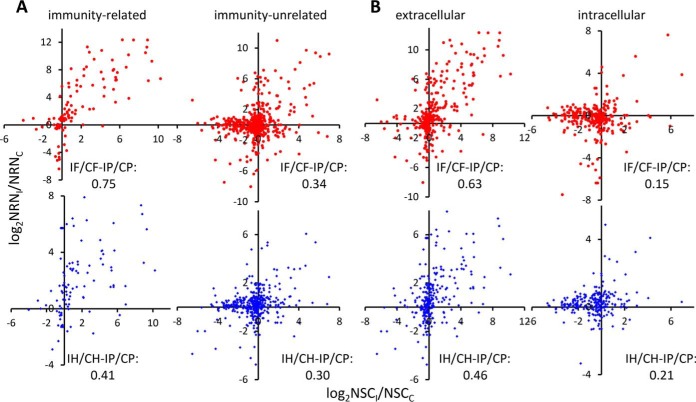
Fig. 4.
Comparison of the mRNA level changes in fat body (red dot, upper) or hemocytes (blue dot, lower) and their protein level changes in the gel samples. (A) immunity-related and -unrelated; (B) extra- and intracellular proteins. See Fig. 3 for the definitions of x- and y-axes.

