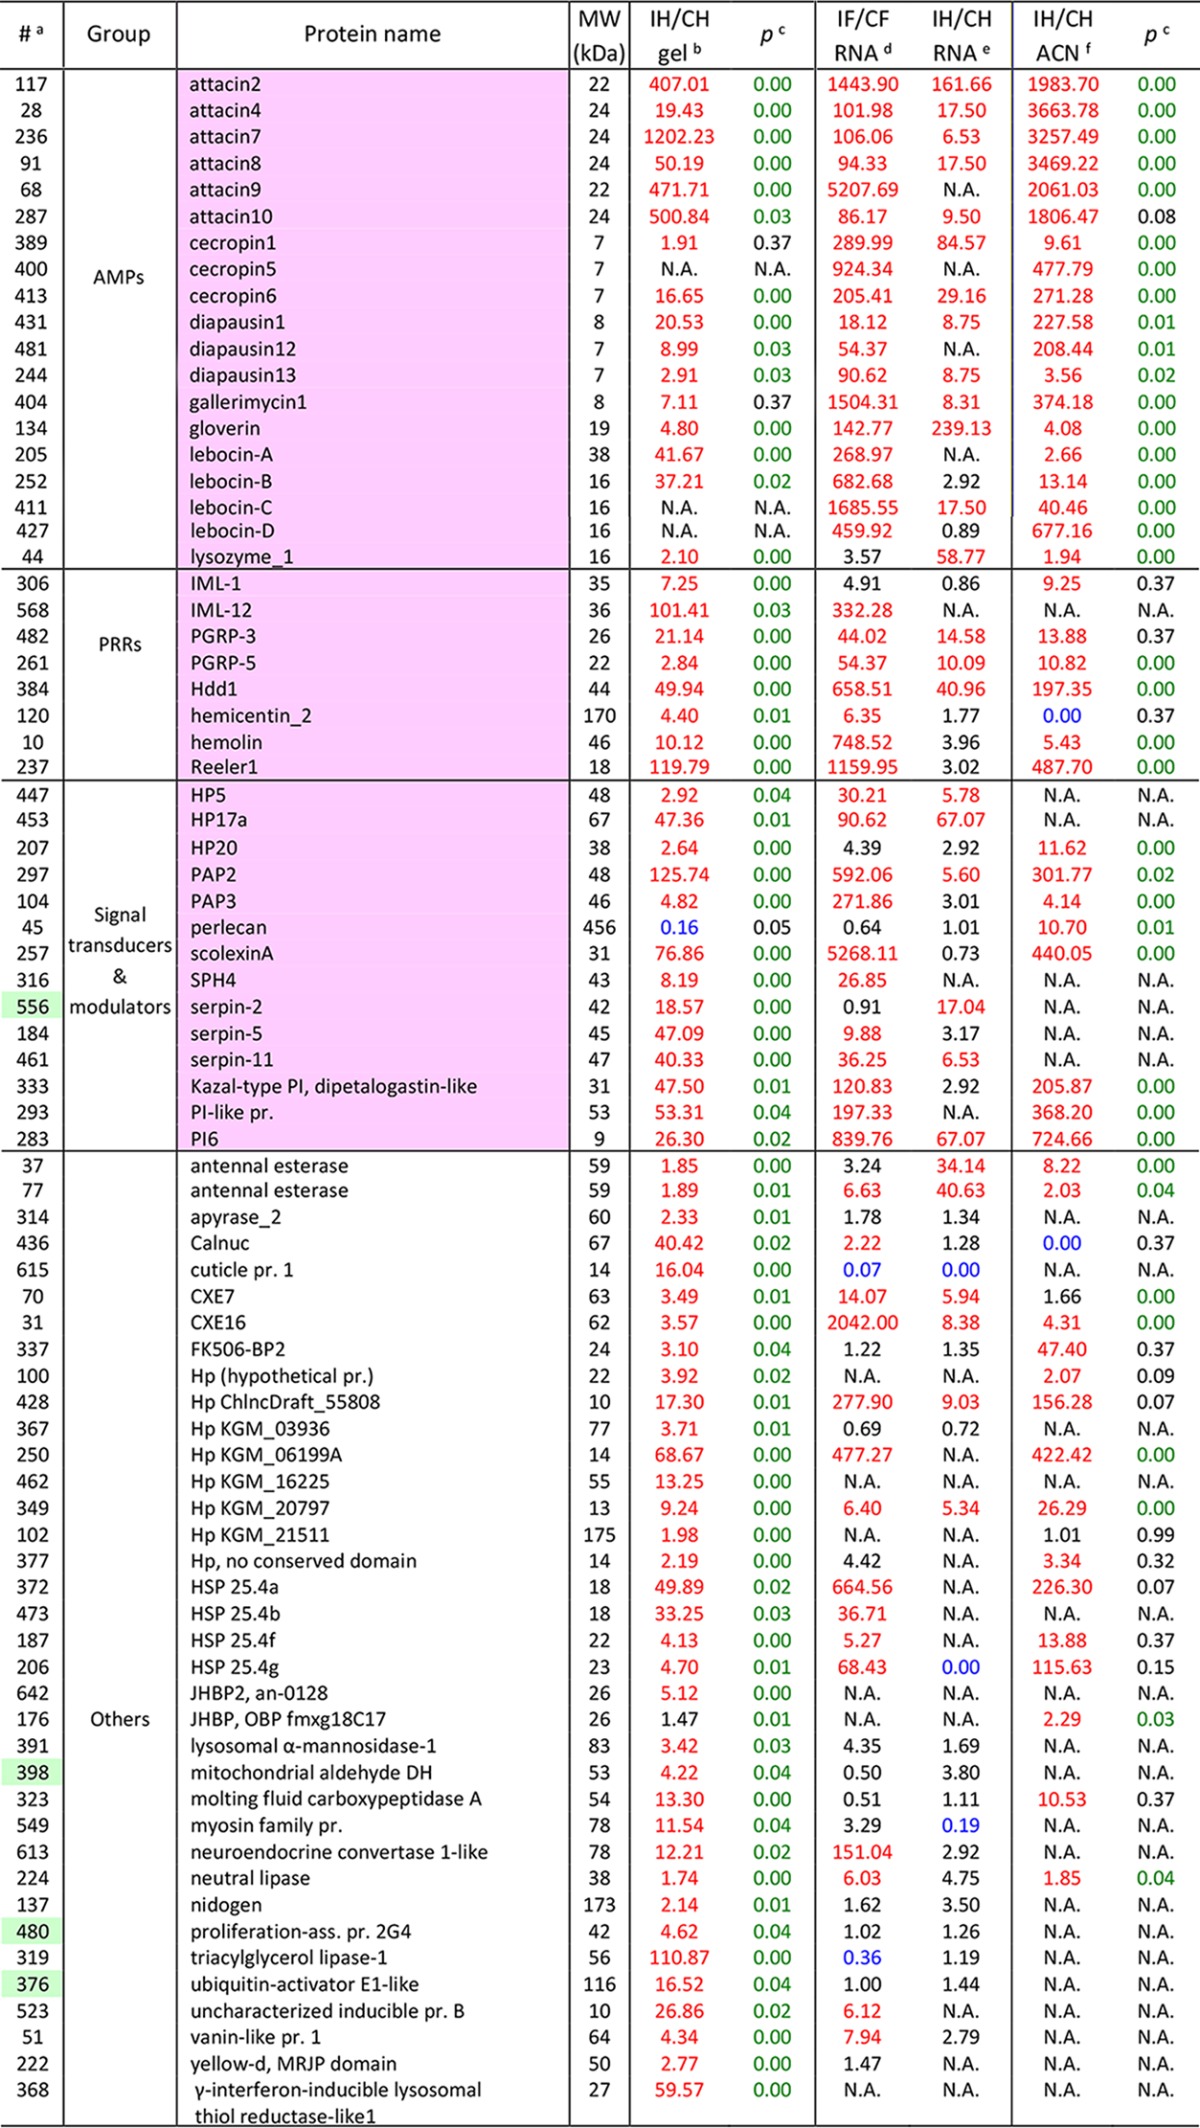
Table I. A list of 77 proteins up-regulated in gel-fractionated and ACN-treated samples after immune challenge.

aProtein identification numbers with the intracellular ones shaded green.
bRatios of average normalized spectral counts (NSCs) of proteins in the induced (I) and control (C) samples separated by SDS-PAGE (I/C >1.67: red; I/C <0.60: blue).
cResults of the Student's t-tests conducted using NSCs of proteins in the I and C samples (p < 0.05: green).
d,eRelative abundances (RAs) or adjusted read numbers (ARNs) of mRNAs in fat body (IF/CF) and hemocytes (IH/CH) (RA or ARN >5, red; RA or ARN <0.2: blue; N.A.: not available) (21).
fRecalculated I/C ratios of average NSCs for proteins identified in the ACN-treated samples (I/C >1.67: red; I/C <0.60: blue). Detailed information of these proteins can be found in Table S2.
