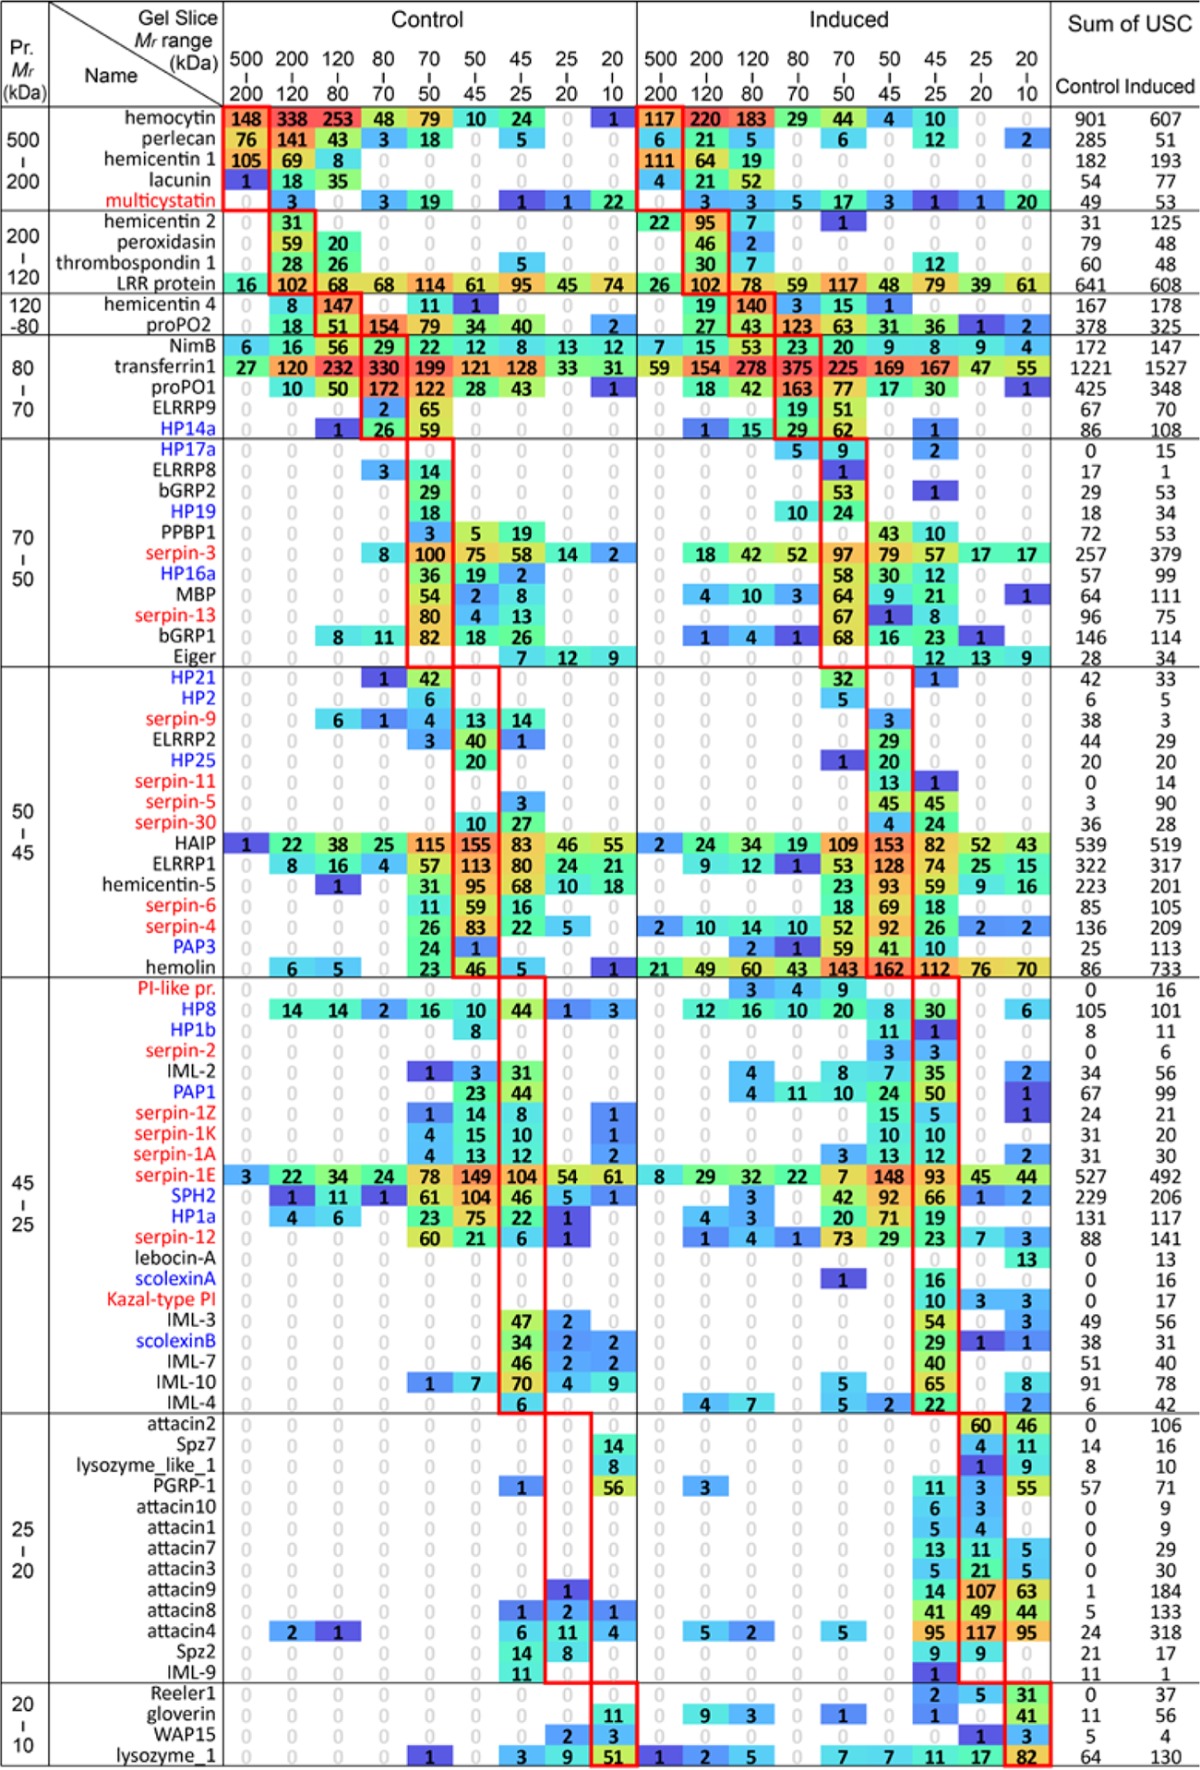
Table II. Distribution of selected immunity-related proteins in different gel slices.

Proteins with unique spectral counts (USCs) in two or more gel slices (Table S5) are tabulated. So are the ones with USCs in one gel slice but their theoretical Mr values do not match the Mr range of that slice. Each cell, labeled with average USC of the three biological replicates, is colored with a gradient from blue to green and then to red based on its log2(USC+1). Red rectangles enclose the slices in which theoretical sizes of the proteins correspond; USCs outside are considered abnormal. SPs/SPHs (including HPs) and protease inhibitors (including serpins) are colored blue and red, respectively.
