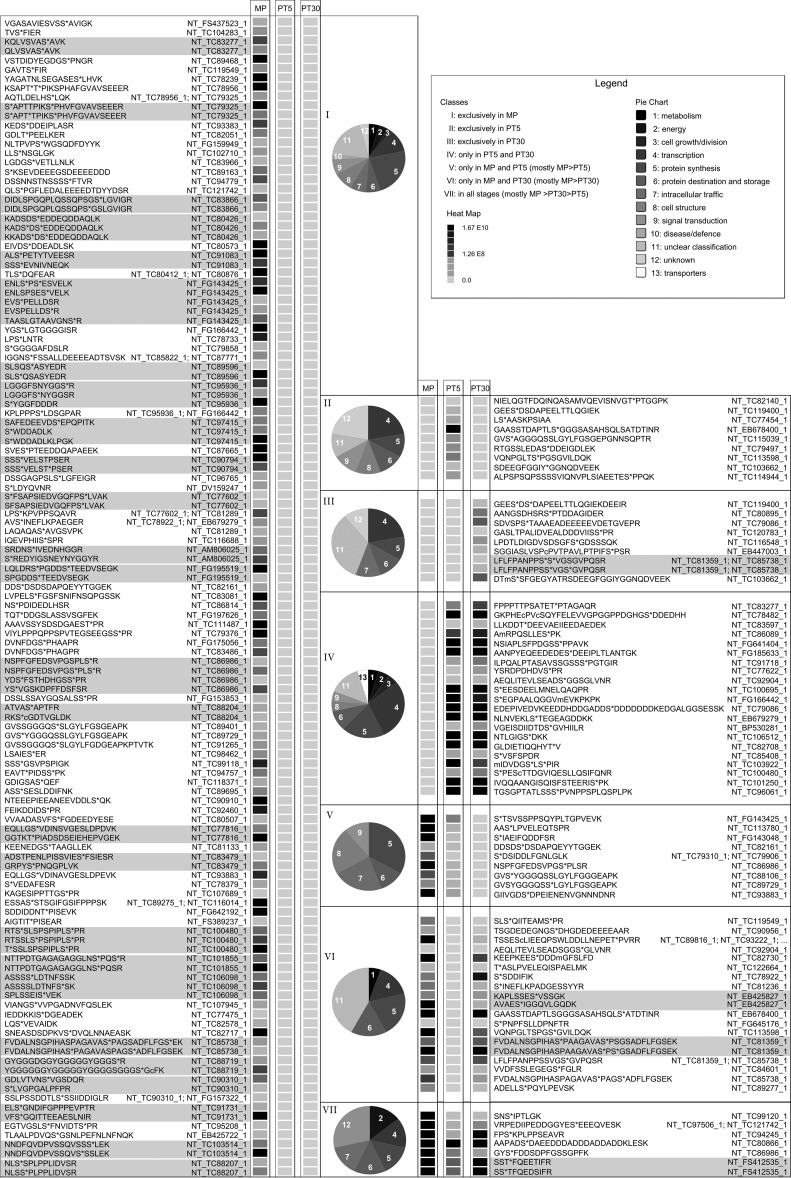
Fig. 4.
Expression profiles of the selected phosphopeptides with a different abundance in the studied male gametophyte stages. The phosphopeptides were sorted into seven regulation groups based on their abundance differences in the three analyzed male gametophyte stages (group I - left panel; groups II-VII - right panel). The relative peptide abundance in each group is shown based on a gray scale (light gray - not detected; black - the highest concentration). Each column represents the average peptide abundance of the three independent LC-MS experiments. In the rows, the normalized abundance of peptides as extracted from the Proteome discoverer LC-MS software is presented. Peptides assigned to one and the same identifier are highlighted in gray. Gene ontology (GO) categories are presented for each group as a pie chart. The full presentation of the data set is provided in the supplemental Table S3.

