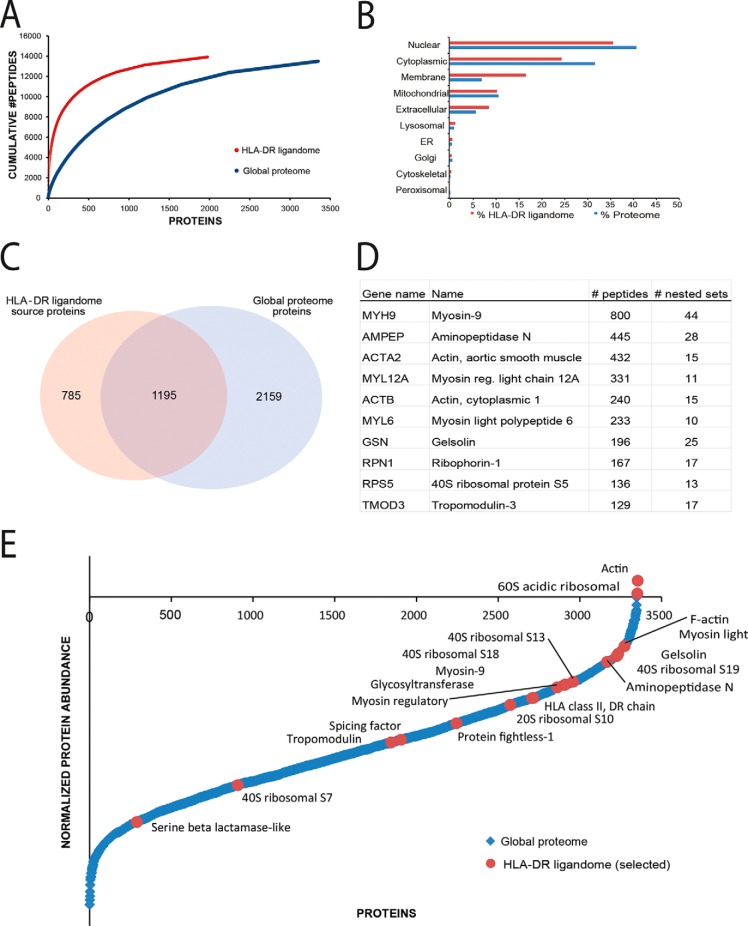
Fig. 4.
Source proteome of the HLA-DR ligandome. A, The cumulative number of unique peptides as function of the number of proteins identified by global proteome (blue) and the HLA-DR ligandome (red) analysis. Proteins are ranked from highest to the lowest number of representative peptides. B, The CELLO2GO algorithm was used to predict the subcellular localization of source proteins obtained by HLA-DR ligandome (blue bars) and global cellular proteome (red bars) analysis. C, Venn diagram showing the overlap between source-proteins identified in the HLA-DR ligandome and the full proteome. D, Source proteins most frequently sampled by HLA-DR with the number of observed unique HLA-DR peptides and number of nested sets. E, Dynamic range plot of the global cellular proteome of MUTZ-3 (blue dots). The assigned proteins (red dots) were the 19 out of 25 most abundantly expressed proteins in the HLA-DR ligandome (6 proteins HLA-DR-sampled proteins were not identified by global proteome analysis).

