Fig. 6.
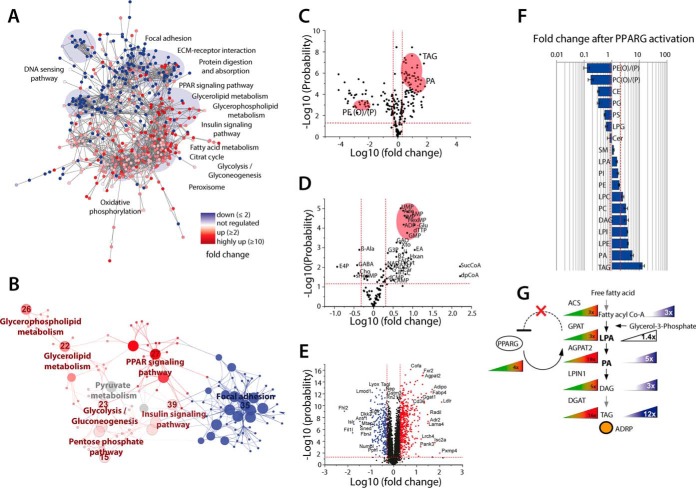
Activated PPAR signaling alters major metabolic pathways and lipid distribution. Mesenchymal OP9 mouse stem cells with the capability to differentiate to adipocytes were treated with 1 μm rosiglitazone for 48 h to induce PPARG signaling. After induction of PPARG, three induced and three unstimulated controls were subjected to the SIMPLEX workflow. (A) Cytoscape network analysis in which the nodes display the quantified proteins and the strings describe the relations between those at the confidence level. All proteins in red are at least twofold up-regulated whereas proteins in blue are at least twofold down-regulated. (B) The prominent regulated pathways at the protein level, here the same color code is applied. (C) Volcano plot of quantified lipids with 222 regulated species after the activation of PPARG signaling pathway, indicating a major remodeling of the entire lipidome. The most relevant molecules regarding PPARG signaling are indicated in red: TAG, PA, and plasmanyl or plasmenylphosphatidyletanolamine PE(O/P). (D) Volcano plot of the regulation of metabolites after PPARG activation. (E) Volcano plot of 3327 quantified proteins, 285 were classified as down-regulated and 435 proteins as up-regulated. (F) Bar plot of major regulated lipid classes. (G) Triacylglycerol synthesis pathway with all major enzymes and lipid abundance changes that are going along with activation of PPARG. For all experiments, the following criteria were applied n = 3 biological replicates and n = 2 for technical replicates.

