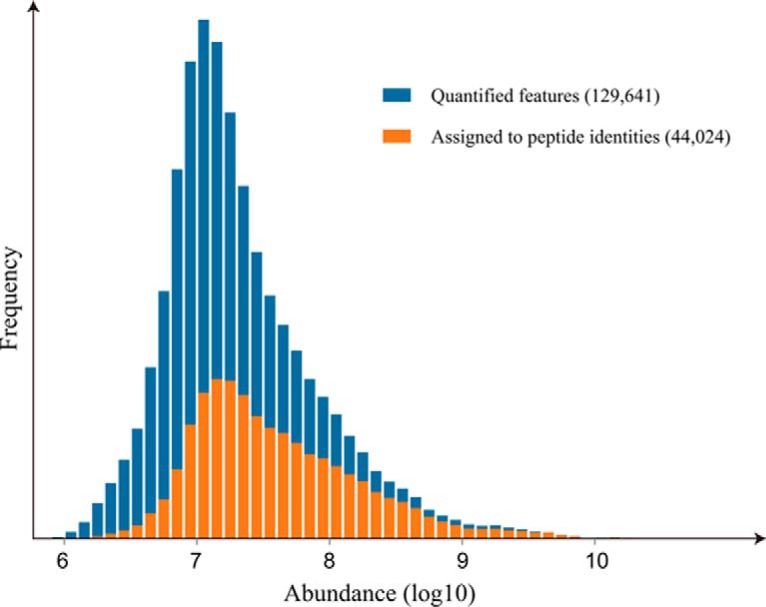
Fig. 5.

Abundance distribution of chromatographic features. Only around one-third of features quantified in DeMix-Q were assigned to MS/MS-based peptide identifications, which is in accordance with the fact that most features were not targeted by DDA and identified by MS/MS but were recorded by full-range MS. Features with higher abundances have higher identification rate, which also reflects the intensity-dependent bias of MS/MS data acquisition.
