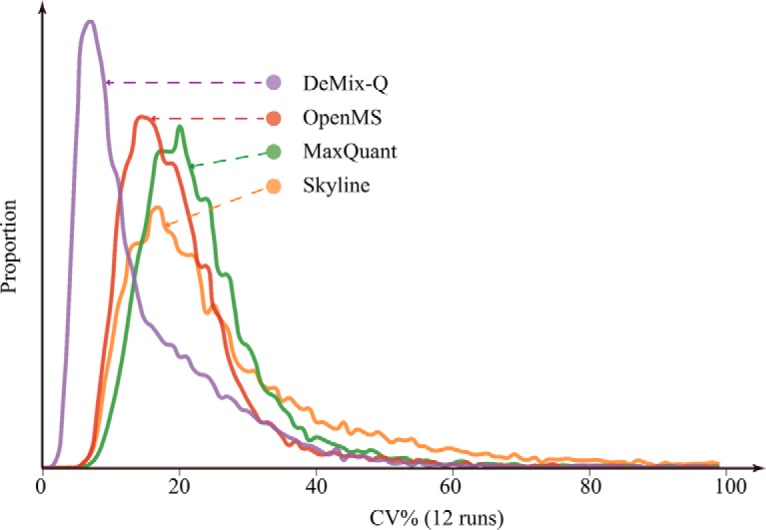
Fig. 6.

Comparison of CV distributions. DeMix-Q provided distinctively lower median CV than other methods, while quantifying the largest number of peptides across all runs. This is achieved primarily due to the introduction of scoring and FDR filtering that prevented large variances from false extractions, and the RT-dependent abundance correction that reduced systematic variability.
