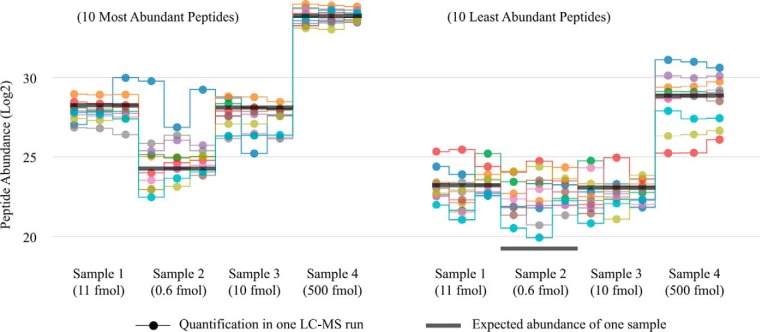
Fig. 7.
Responses from peptide abundances to actual protein concentration differences. The abundances of the 10 most-abundant peptides from a spiked-in bovine serum albumin (left) well correlated with the known protein concentrations, except for the outlier peptide (blue). However, the least-abundant 10 peptides (right) turned out to be less responsive to the actual protein concentration changes. The expected abundances (dark gray lines) were calculated: for sample 4 (that has the highest spike-in amount, 500 fmol)—as the average log2 peptide abundances (33.8 for top-10 and 28.5 for bottom-10 peptides); for samples 1, 2, and 3—as the corresponding log2 fold-changes compared with sample 4 (–5.5, –9.7, and –5.64, respectively).

