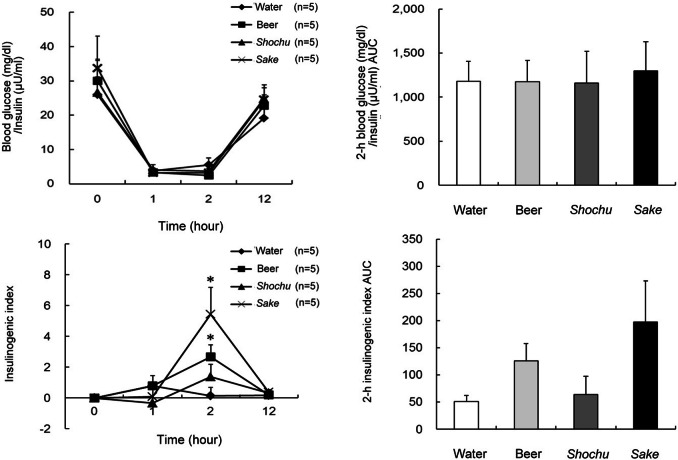
Figure 2. Blood glucose and insulin ratio levels, and insulinogenic index after drinking four types of beverages in healthy subjects.
Blood glucose and insulin ratio levels (A1), the 2-h area under the curve (AUC) values for blood glucose and insulin ratio (A2), insulinogenic index (B1), and the 2-h AUC values for insulinogenic index (B2) after drinking four types of beverages in healthy subjects. Data are expressed as mean ± standard error (n = 5). Two-way repeated measures analysis of variance and post hoc analysis using least significant differences were used to compare clinical data between the beverages. ∗p < 0.05, compared with water.

