
FIGURE 3.
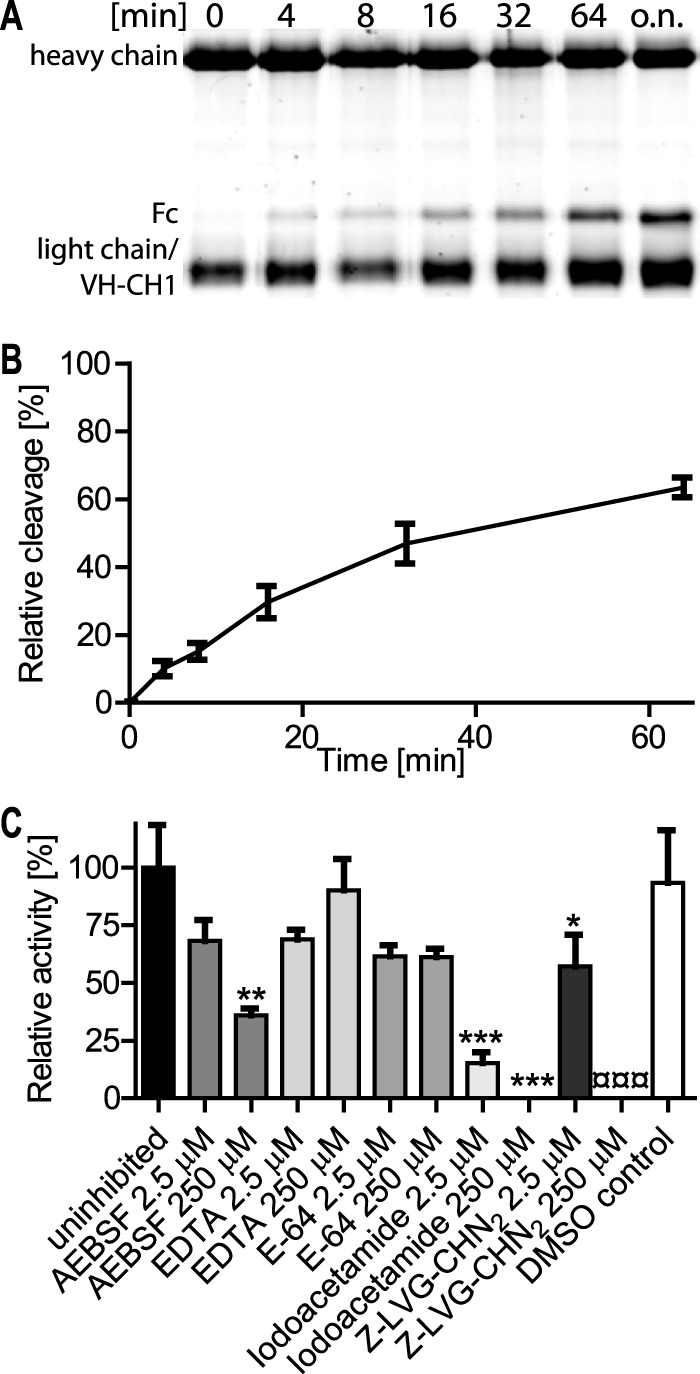
Time course and inhibitor profile of recombinant IgdE. Porcine IgG (1.67 μm) were incubated with 2 μm purified IgdEΔC at 37 °C. The time course of cleavage was monitored by continuous sampling prior to Coomassie Fluor Orange stained SDS-PAGE under reducing conditions. A, a representative gel of a cleavage assay is shown. B, the amount of cleavage product was densitometrically quantified and cleavage obtained after overnight incubation (16 h) was set as 100% relative cleavage (n = 4). C, for the inhibitor profile initial cleavage in the presence of 250 or 2.5 μm of each inhibitor was monitored. Initial cleavage activity of the uninhibited control was set as 100% relative activity. The DMSO control correlates to 250 μm Z-LVG-CHN2. Data are presented as mean ± S.E. of three experiments. Differences to the uninhibited control (*) or DMSO control (¤) were analyzed by Dunnett's multiple comparison test with significance set at p values of <0.05 (*), <0.01 (**) and <0.001 (*** or ¤¤¤) (n = 3).