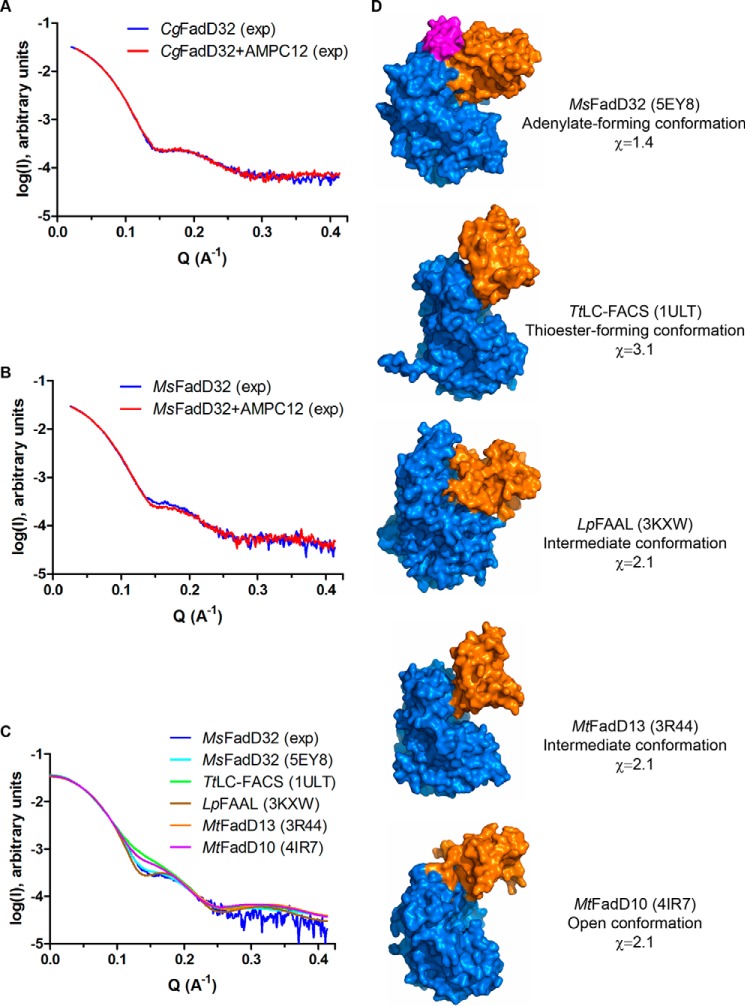
FIGURE 10.
SAXS analysis of FadD32. A, experimental SAXS data for CgFadD32 in the unbound state (blue line) and in the presence of AMPC12 (red line). B, experimental SAXS data for MsFadD32 in the unbound state (blue line) and in the presence of AMPC12 (red line). C, comparison of the experimental SAXS data for unbound MsFadD32 (blue line) and theoretical scattering patterns computed from structures of representative conformations for AFEs: MsFadD32 (this work, PDB code 5EY8, cyan line), the long-chain fatty acyl-CoA synthetase from T. thermophilus (TtLC-FACS, PDB code 1ULT, green line), the fatty acyl-AMP ligase from L. pneumophila (LpFAAL, PDB code 3KXW, brown line), FadD13 from M. tuberculosis (MtFadD13, PDB code 3R44, orange line), and FadD10 from M. tuberculosis (MtFadD13, PDB code 4IR7, magenta line). D, surface representation of the structures used in C. The structures were superimposed on the basis of the N-terminal domain (marine) and are shown in the same orientation. The C-terminal domain, which adopts a different conformation, is shown in orange. The conserved FAAL motif of FadD32 is shown in magenta. Information is provided about the name of the enzyme, the type of conformation observed, and the χ value indicative of the quality of fit between the experimental diffusion curve and the theoretical curve computed from the corresponding structure.

