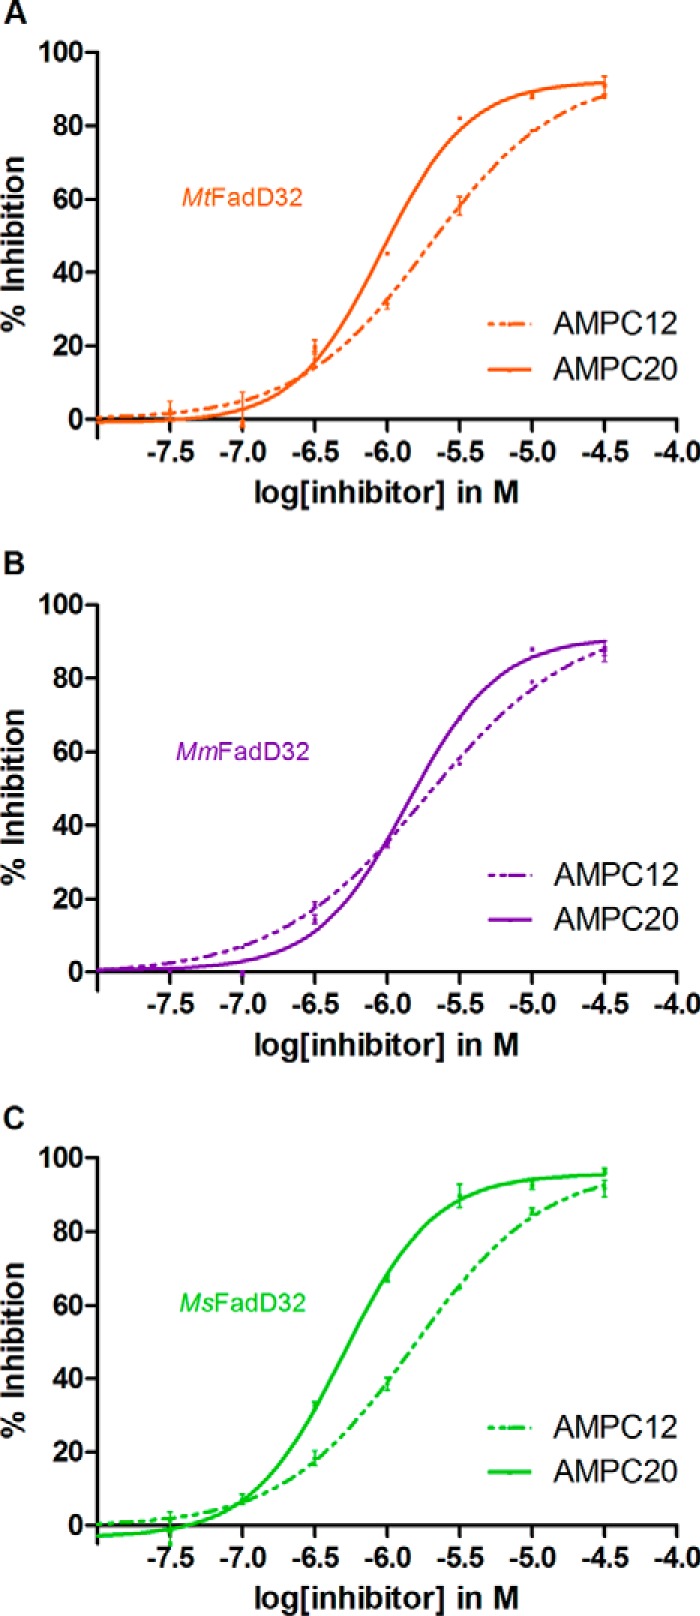
FIGURE 3.

Curves for the inhibition of FadD32 activity by AMPC12 and AMPC20. Various concentrations (0.03–31.6 μm) of the compounds were added to the assay, and FadD32 activity was measured in the presence of 1.6 mm ATP and 100 μm lauric acid as substrates. Means and standard errors of the mean are shown for four replicates. IC50 (half-maximal inhibitory concentration) was calculated from the dose-response curve. A, MtFadD32. B, MmFadD32. C, MsFadD32.
